How to Download the Free Perceptual Map Excel Template
- Click the download link in the next section below
- Open the downloaded Excel file
- Click to enable editing
- .Follow the instructions in the spreadsheet – or watch the instructional video (see further below) – plus FAQs at the end of article
Get Your Free Perceptual Map Template
Please note that there are two variations of the SAME mapping template below – depending upon the scale of your data
- If your data is in a 1 to 9 scale, then please click here to download your Free Download of the Perceptual Map Template
- If your data is in a 1 to 5 scale, then please click here to download your Free Download Perceptual Map Template=1 to 5 Scale
Please note is your data is in a different scale, then BOTH templates have a build in data convertor that enables you to change the data scale.
And if you have lots of perceptual maps to create, review and analyze – then you should take a look at the fast mapping Excel template at Make 100s of Perceptual Maps Really Fast
Also review: Free Template Terms of Use
Overview of the Excel Perceptual Map Maker
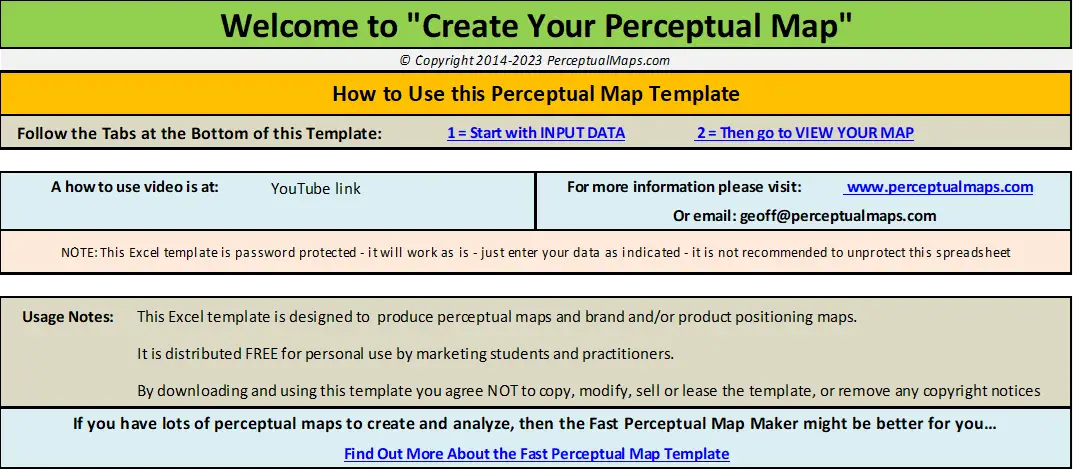
When you open the perceptual map template, it looks like this…
Using the Mapping Template is Very Easy
You first go to “INPUT DATA“, which you can access by selecting the tab at the bottom or clicking a link on the first page that the spreadsheet opens to (as per the image above).
Then you will see the following tab in the template…
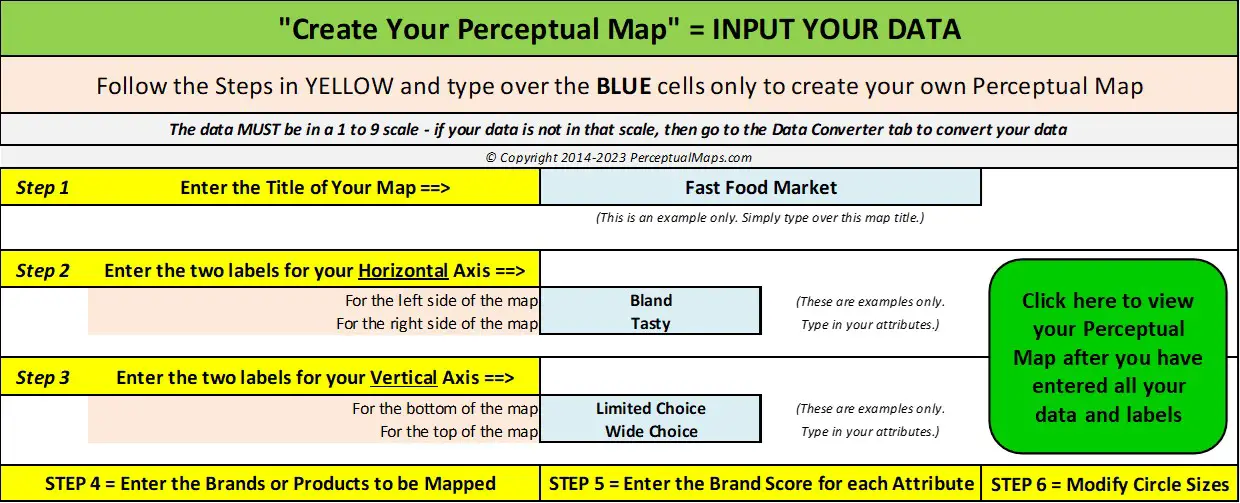
As you can see, there are six clear steps to follow, which are:
- Step 1 = enter the name (chart title) for your perceptual map
- Step 2 = enter the two labels (product attributes) for the horizontal axis*
- Step 3 = enter the two labels (product attributes) for the vertical axis*
- Step 4 = enter the names of the brands or products to be placed on the map
- Step 5 = score each brand or product for each attribute on 1 to 9 scale**
- Step 6 = modify the circle sizes on the template, if required***
Mapping Template Notes
* If you need ideas for your brand/product attributes, then this attributes page has a full list of suggestions for your attributes (which are the axis labels)
** If your data is not in a 1 to 9 (or a 1 to 5) scale, then the template has a built-in “Data Converter” tab that allows you to scale data in any scale to the required 1 to 9 (or 1 to 5) scale
*** If you require different circle sizes for different brands, then you can change the relative sizes between them in this step – but this is optional and is not required
The Template’s Perceptual Map Output
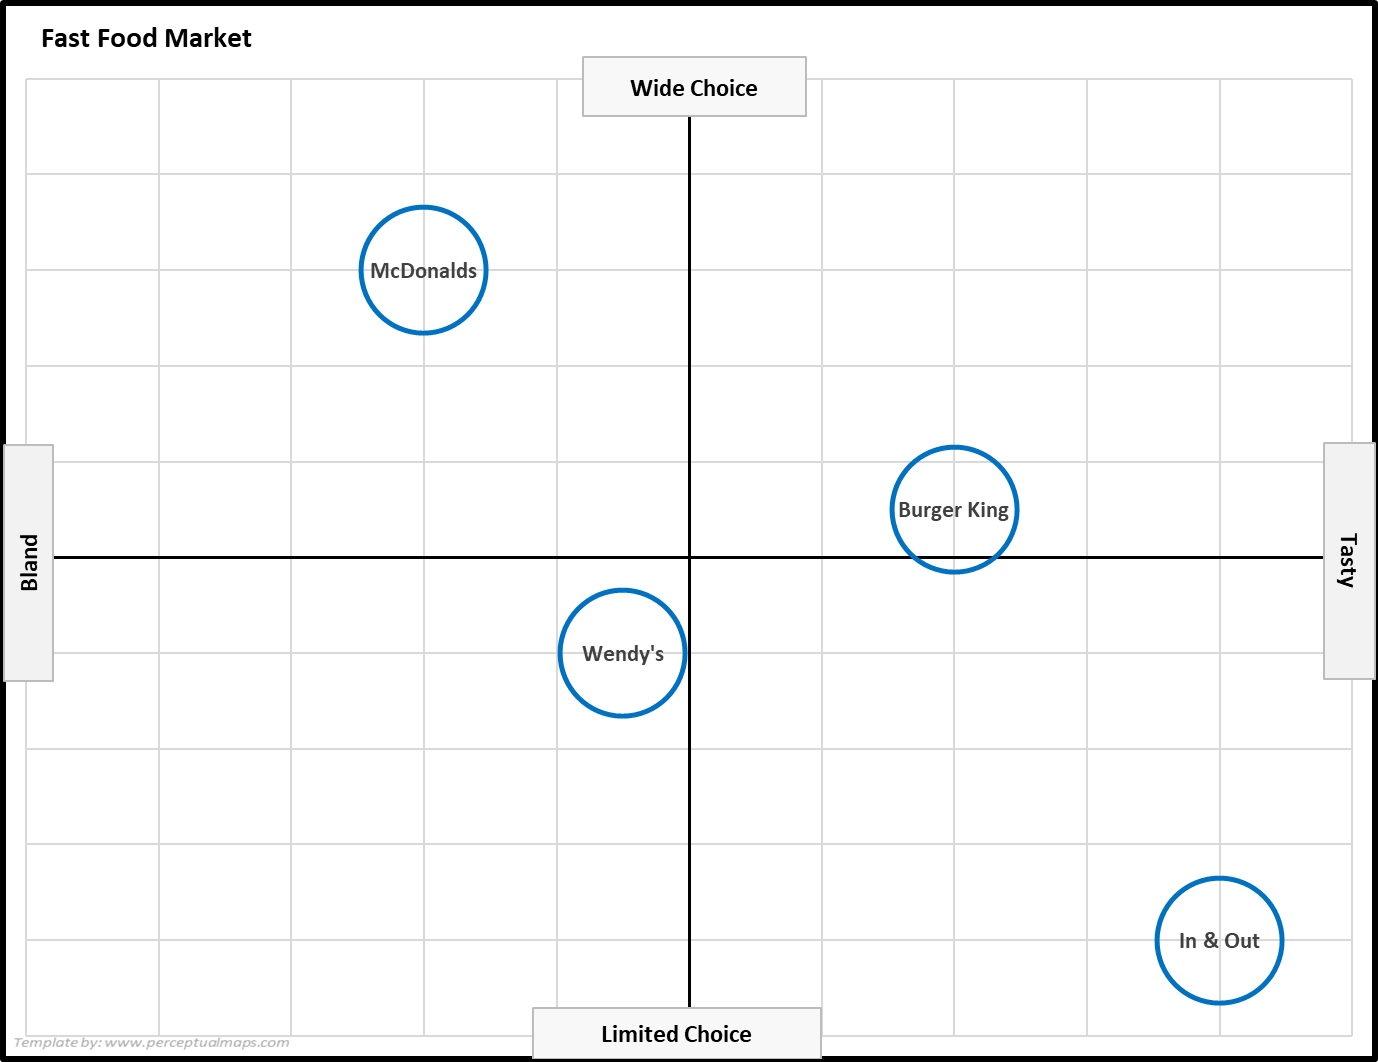
After you enter your mapping data (that is, the axis/attribute labels, list of brands/products/firms, and attributes scores), then the perceptual map (a fast food example below) is automatically produced in the next tab of Excel looks like this…
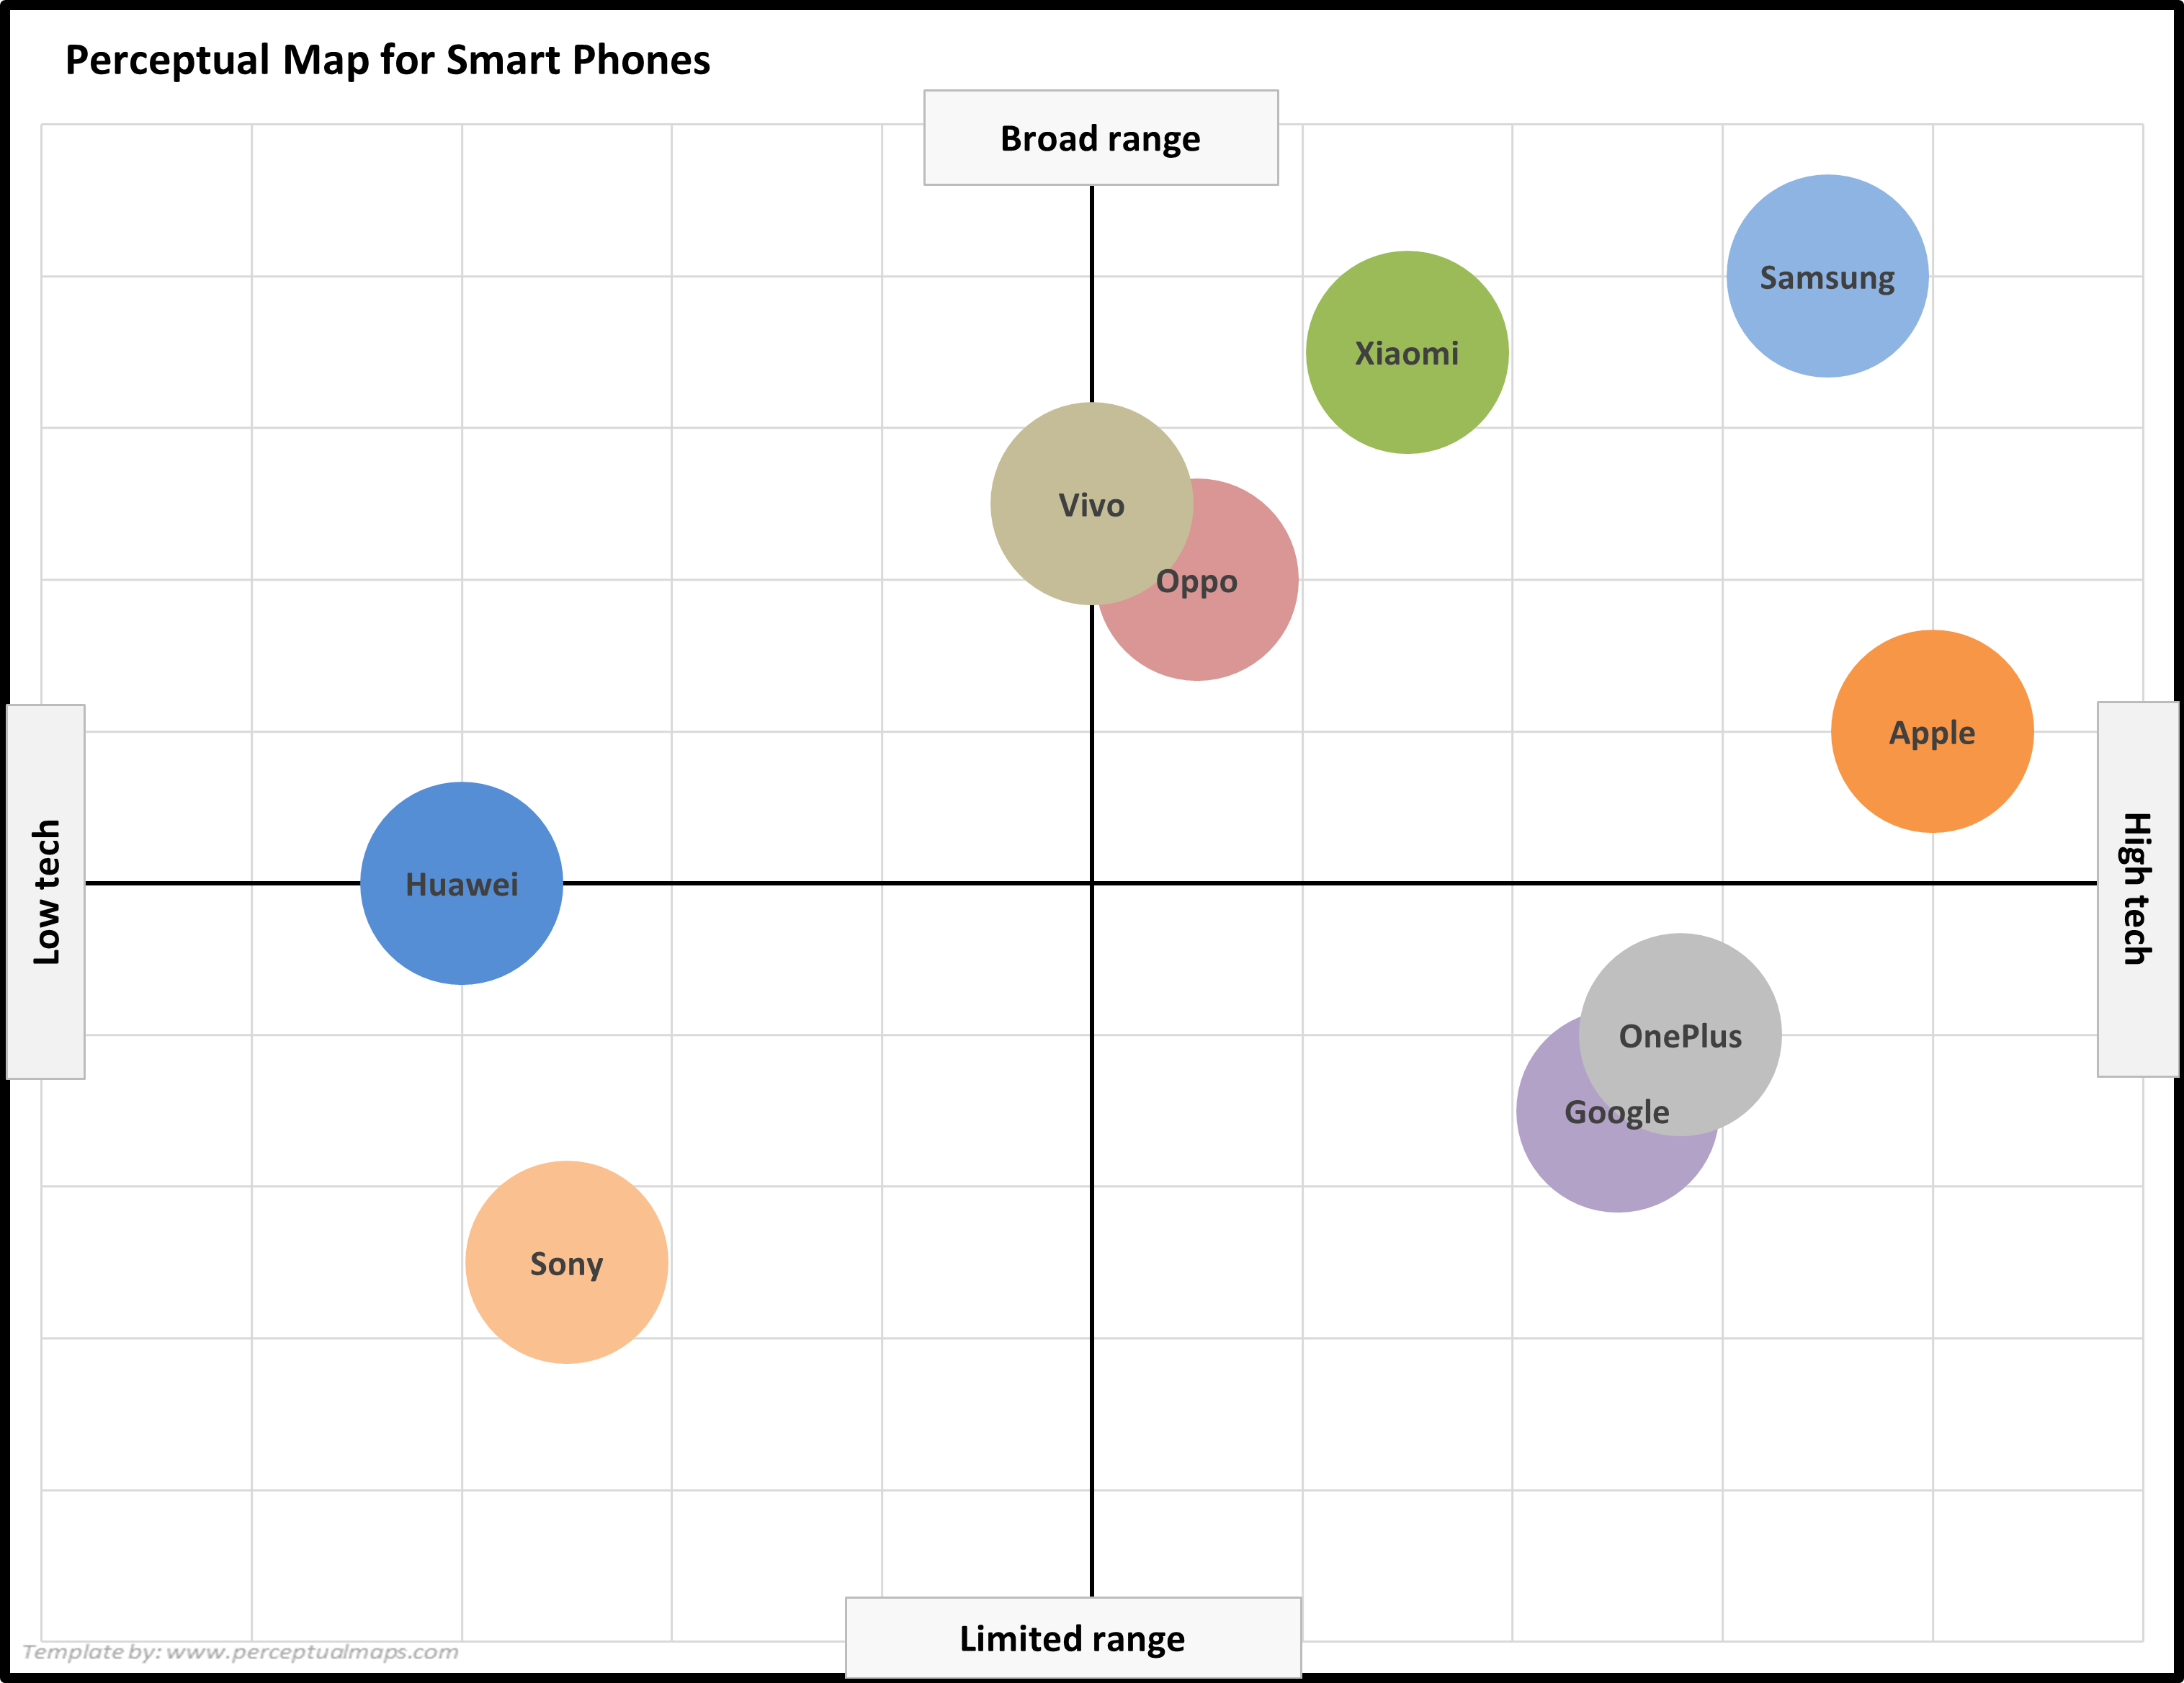
You will also find that there are 4 variations of the perceptual map listed in this tab, each with a slightly different format and look depending on your needs. For example, here is another example perceptual map (this time for smart phone brands), but with colors to give it a different look.
What Types of Perceptual Maps Can Be Produced?
If you scroll down to the Extra Information section, you will see that there are multiple methods of mapping the market and its competitors.
However, this Excel template is designed to map:
- Consumer perceptions of brand positions
- Brand positions (or positioning)
- Product positioning
- Competitor positions (or positioning)
- Consumer perceptions of brand positioning and/or product positioning
For further information, please see
- Different Types of Perceptual Maps
- What’s the difference between a perceptual map and a positioning map?
What’s New in the Perceptual Mapping Generator?
The mapping template is maintained and regularly updated and improved. The latest version now includes:
- The ability to now map up to 50 brands (or products)
- Four different output variations of the perceptual map, depending on your preferences
- A grid-like background on the map, for easier analysis
- A choice of two mapping templates – either for image data in a 1 to 9, or a 1 to 5 scale
- A data converter spreadsheet (in a separate worksheet tab) – that allows you to convert data in any scale into a 1 to 9 (or a 1 to 5) scale for improved formatting and presentation of your perceptual map
- Improved instructions – although this Excel template is very easy to use, simple step-by-step instructions are available to follow
- In-template links to easily navigate between the data and the map
- A blank worksheet for copying and pasting suitable maps for later use and analysis
Tips on Using the Perceptual Mapping Template
Use Consumer Data
Perceptual maps are designed to show the perceived positioning of brands in the marketplace. This positioning information (data) should be based upon the perceptions of consumers wherever possible.
If you do not have access to suitable consumer data, then the data (perception scores) should be estimated from the consumer’s viewpoint, not the view of management or other estimation. In other words, how do consumers see the position of these brands?
Look at the Perceptions of Different Target Markets
Perceptual maps relatively quick and easy analysis tools that provide significant insight into the marketplace. You need to ensure that you analyze more than ONE perceptual map to really gain the benefits of this technique.
A very simple approach is to map the perceptions of different target markets. Therefore, rather than looking at the overall market (all consumers at once), instead construct multiple perceptual maps each with the perception of a unique target market.
This approach is important because we will gain a greater understanding of how we are competing and are positioned for our key target markets. If we use all consumers (that is, all market segments combined) then the perceptions of these different target markets are “averaged out). This will create a misleading view of the market for us.
Use Multiple Attributes on the Map
One of the advantages of a perceptual map is that it is a very effective analysis tool. It allows us to go through customer survey and image data and map various positioning attributes and identify opportunities, competitive strategies, and other market insights.
It is a big mistake when using a perceptual map to only consider two attributes – especially those that are pre-chosen for the analysis. Instead, we need to look at a variety of positioning attributes on our map’s axes, which should deliver key market insights for us.
In other words, let’s use the image data to work out where our brand’s strengths and weaknesses are according to consumers and our target markets – as opposed to just randomly choosing two attributes for the perceptual mapping exercise.
Show Consumer Perceptions over Time
Where possible, map the changing perceptions of consumers towards our and competing brands over time. For example, map both our current position and our previous position (say last year) on the same map. And did the same for our competitors.
By adding this extra layer of information, we gain insight into our competitive strategy and how they are trying to position their products in the marketplace – plus we can assess the effectiveness of our recent marketing and brand image efforts. It becomes a qualitative measure of marketing effectiveness.
View the Market at Different Levels
Most perceptual maps presented in marketing textbooks will have the viewpoint of the overall market. That is, they look at all competitors in the same market or product category at the same time.
However, there are multiple ways to construct perceptual and we do not need to limit ourselves to the market only. By taking a higher perspective, we can map our product category against substitute product categories and assess the strengths and weaknesses of our indirect competitors.
We can also drill down and look at competitors who are only competing in our target market, all competitors who are relatively similar in nature – for example, only looking at competitors in the premium end of the market.
Again, by using multiple maps that view the market at different levels (high and lower) we are more likely to gain valuable market insights and more likely to gain a better understanding of the marketplace overall.
Extra Information Available on this Perceptual Maps website
The template uses a traditional two-axis perceptual map that is usually taught to marketing undergraduate students.
But please note that positioning maps can be constructed in different ways. Therefore, this website has several templates available that can produce different forms of positioning maps, including:
- Overall similarity (OS) maps
- Multi-dimensional scaling (MDS) maps
- Radar chart maps
- Bubble chart maps
And you should also check out… Perceptual Maps: Best Practice
And while this spreadsheet is easy to use, you can follow these instructions for more information.
Plus you can produce all the perceptual maps in COLOR, please see the section on how to format your map.
There is also a separate data convertor spreadsheet available if your starting data is not in a 1 to 9 point scale – but this is now automatically included in the latest updated template.
Check Out Multi-Map Template
If you need to construct more than one perceptual map – which is the most common scenario – then you might be better off with the Fast Perceptual Map Maker. This template allows the input of up to 25 attributes and up to 25 brands, which then enables you to review up to 300 perceptual maps amazingly fast. A great analysis tool.
Instructional Video on Using the Perceptual Map Template
The following video walk through how to use the Excel mapping template.
FAQs About The Perceptual Map Template
Need Help?
If you have any problems, just email me and I’ll see if I can help you. (email = geoff@perceptualmaps.com)
How do I edit the template?
The free mapping template contains protected cell and cannot be edited. If you are seeking an editable version, then it is available for purchase at my related marketing educators (Great Ideas for Teaching Marketing) resource site for just $15.
I don’t have Excel, can I still use the template?
Yes, this template should work in Google Sheets and Apple’s version of Excel.
My map is not working, what should I do?
This Excel perceptual map template has been tested and should work. If your map is not working, and please reread the instructions on the template, or alternatively, view the instruction video above.
Can I change colors in the map?
Yes, this is easy to do. Click on the circle/bubble that you wish to change and then the chart menu will pop up in Excel and then click format and choose the color that you prefer.
How do I change circle sizes?
There is an optional step in the template that allows you to change circle sizes. However, this is a relative dimension, with the size of the circles being dependent upon the other scores. For example, a circle size of 9 will be much larger than a size of 1. But if all circles are size 9, then all circles will be the same.
If you want to resize ALL circle sizes:
- Click on any circle top highlight it
- Right click to bring up ‘Format Data Series’
- In the menu (pops up to the right), enter a value in ‘Scale bubble size’
Do I Need a Password?
PLEASE NOTE: No password is required!
There are formulas and calculations scattered across the spreadsheet, so the key cells have been protected to ensure that the template runs without errors.
Follow the instructions and enter your data as indicated – the template will work fine and no password is required.
Related Information
- How to Effectively Use Perceptual Maps
- Using Perceptual Maps to Understand Competitive Sets
- How to Make a Perceptual Map in Excel 365
- Which Perceptual Map Template Should I Use?
- What is the STP Process?
- Study Notes for Positioning
PERCEPTUAL MAP EXAMPLES
- Example Perceptual Maps for Breakfast Cereals
- Example Perceptual Maps for Streaming Services
- Example Perceptual Maps for Restaurants
- Example Perceptual Maps for Smart Phones
- Example Perceptual Maps for Soda (Soft Drinks)
- Example Perceptual Maps for Candy Bars
- Example Perceptual Maps for Fast Food
- Example Perceptual Maps for a Coffee Shop
- Example Perceptual Maps for Retailers