Contents
- 1 How to Generate Market Insights from Your Perceptual Maps
- 2 1 = Make Sure You Make Lots(and lots) of Perceptual Maps!!!
- 3 2 = Make Sure You Use Determinate Attributes
- 4 3 = Make Sure You Map at Segment-Level, Not the ‘Average’ Market
- 5 4 = Make Sure You Look at Different Levels of the Market
- 6 5 = Make Sure You Use Time-based Perceptual Maps
- 7 6 = Make Sure You are Realistic with Positioning Goals
- 8 7 = Make Sure You NEVER Use Price and Quality on the Same Perceptual Map
- 9 8 = Make Sure You Use Consumer Data, Not Management Opinions
- 10 9 = Make Sure You Remove Brands Always in the Middle of Maps
- 11 10 = Make Sure You Always Use Excel
- 12 11 = Make Sure Use Other Perceptual Mapping Tools
How to Generate Market Insights from Your Perceptual Maps
In this article I outline some important tips and tricks for using perceptual maps. Why? Well, while perceptual maps are relatively simple, they are can be a very powerful tool for marketing analysis provided they use correctly.
But most people do not use perceptual maps effectively. Instead they run one or two simple maps using a limited set of attributes. In other words, they don’t use perceptual mapping as an analytical tool. Let’s fix that in this post!
Here is the list of my recommended perceptual mapping practices…
- 1 = Make Sure You Make Lots (and lots) of Perceptual Maps!!!
- 2 = Make Sure You Use Determinate Attributes
- 3 = Make Sure You Map at Segment-Level, Not the ‘Average’ Market
- 4 = Make Sure You Look at Different Levels of the Market
- 5 = Make Sure You Use Time-based Perceptual Maps
- 6 = Make Sure You are Realistic with Positioning Goals
- 7 = Make Sure You NEVER Use Price and Quality on the Same Perceptual Map
- 8 = Make Sure You Use Consumer Data, Not Management Opinions
- 9 = Make Sure You Remove Brands Always in the Middle of Maps
- 10 = Make Sure You Always Use Excel
- 11 = Make Sure Use Other Perceptual Mapping Tools
You can either review the video, or scroll down for the full article…
1 = Make Sure You Make Lots(and lots) of Perceptual Maps!!!
What, more than one map? YES…
The number of times I see companies or students jump at one solution – hey let’s pick that attribute and that attribute, and we’ll make a map out of it and put it in our report, and that’ll be fantastic.
What they are doing is guessing the important attributes and where the brand will stand out against competitors – often to present a best case scenario.
And how do well know which two attributes we should put on a map? Well, we just don’t know. It’s just a guess.
Our goal as marketing analysts and/or marketers (when analyzing) is to identify insights. The only way we can do that is to go through perceptual map after perceptual map.
If we’ve spent a lot of the company’s money on doing surveys and image data and getting all that information, why we’re just using one map? The more maps we use, the more insights, the more understanding we’ll have of the marketplace.
Remember – perceptual maps have two main roles:
- As an analytical tool
- As a visual communication tool
But most marketers only use mapping for visual representation of brand positioning in their reports and presentation. And they are neglecting the powerful analytical ability of perceptual maps. That’s why it is critical to run multiple – lots and lots of – perceptual maps in your marketing analysis.
If that sounds like a lot of work, then check out my easy-to-use Excel template at… Make 100’s of Perceptual Maps Really Fast.
With this template you can produce many maps very quickly by preloading the data and attributes – and with a click of a button you can produce map after map to review.
2 = Make Sure You Use Determinate Attributes
Don’t just pick any attributes for a perceptual map that goes into a final report. Pick the ones that determine choice. That is, which ones are the consumers making using to make a decision between key competitors? These attributes are known as “determinate attributes”.
Let’s use an example for an airline.
We want to go on a plane to somewhere. Price is important. The brand is important. Convenience is important. And we undertake out information search and find three airlines that are all relatively similar – great, we now have our consideration set – but which one do we choose? How do we decide between then?
That’s what determinant attributes are – the next level down attributes that a consumer looks at after all the important ones have been considered.
And doe an airline it can drill down to a relatively simple decisions of, “They give us food on that airline the other one doesn’t” or “This one’s got a bit more legroom.”
So, something as simple as food and seating can be the attributes that make consumers choose between two competing airlines.
Here’s a hotel example.
If you’re going on holiday and you want to pick a hotel. Again we have three similar hotels – great location, good price good reviews – now what?
It might be, “Gee, they have a big swimming pool. They have a smaller swimming pool. We’ll go for that one.”
Again, as the most important attributes are perceived to be relatively similar by consumers, they are forced to look at “lower level” product attributes in order to make their decision and choose the best brand. We need to understand which attributes are being utilized for the consumer’s choice – these are determinate attributes – and we need to consider them on a perceptual map.
This approach to consumer decision making is shown in the following diagram.

You can learn more about determinant attributes in this article.
3 = Make Sure You Map at Segment-Level, Not the ‘Average’ Market
We need to map the perceptions of key market segments – and most importantly, our target market/s. This is as opposed to mapping the total market, where we get the views and perceptions of the “average consumer”.
In most cases, we are not interested in the average consumer – but rather the perceptions of our target market. Indeed, it is quite valuable to see how our brand is positioned in the minds of consumers in different market segments.
This is very helpful for understanding the effectiveness of our segmentation, as well as how our brand is perceived by different consumers. This may lead to a redefinition of our target market or perhaps the pursuit of additional target markets.
It also provides valuable insight into our strengths and weaknesses in terms of brand positioning and brand distinctiveness.
Given that we should be making lots of maps (as per point 1 above), we should also take the time to split our consumer data into segments. And if we have access to customer image survey data results, then we can even drill down further and look at our brand in niche segments.
Collectively, this more extensive perceptual mapping and analysis will deliver greater insights, identify more opportunities, and give us greater feedback on the strength of our current brand positioning and how to improve it.
4 = Make Sure You Look at Different Levels of the Market
We need to think of perceptual maps as being a form of a “microscope” – where we can zoom in and zoom out on the market and its products.
In most cases, perceptual maps are constructed to review direct or key competitors only. This means that the perceptual map is focused on the product category market. This approach to mapping is critical, but we can extend into other views of the market.
For example, we can zoom out and take a look at indirect competitors, substitute products. By doing this we can get a sense of other product categories and see we’re being threatened. That is, what other industries or what other products may be taking our sales away.
This is important because often we are so focused on direct competitors, that we fail to see the impact and threat of substitute products and other indirect competitors. These often have a more substantial impact on our long-term success than market share battles against direct (and known) competitors.
And we can also use our perceptual map “microscope” to down into a product space to look for like-for-like products. This means getting beyond brand or company level, and analyzing perceptions at an individual product base. For example, McDonald’s could compare the consumer perceptions of their Big Mac against Burger King’s Whopper and other well-known products.
This “microscope” approach allows us different ways of looking at the marketplace. But obviously, this ability depends upon our data and what we’ve collected.
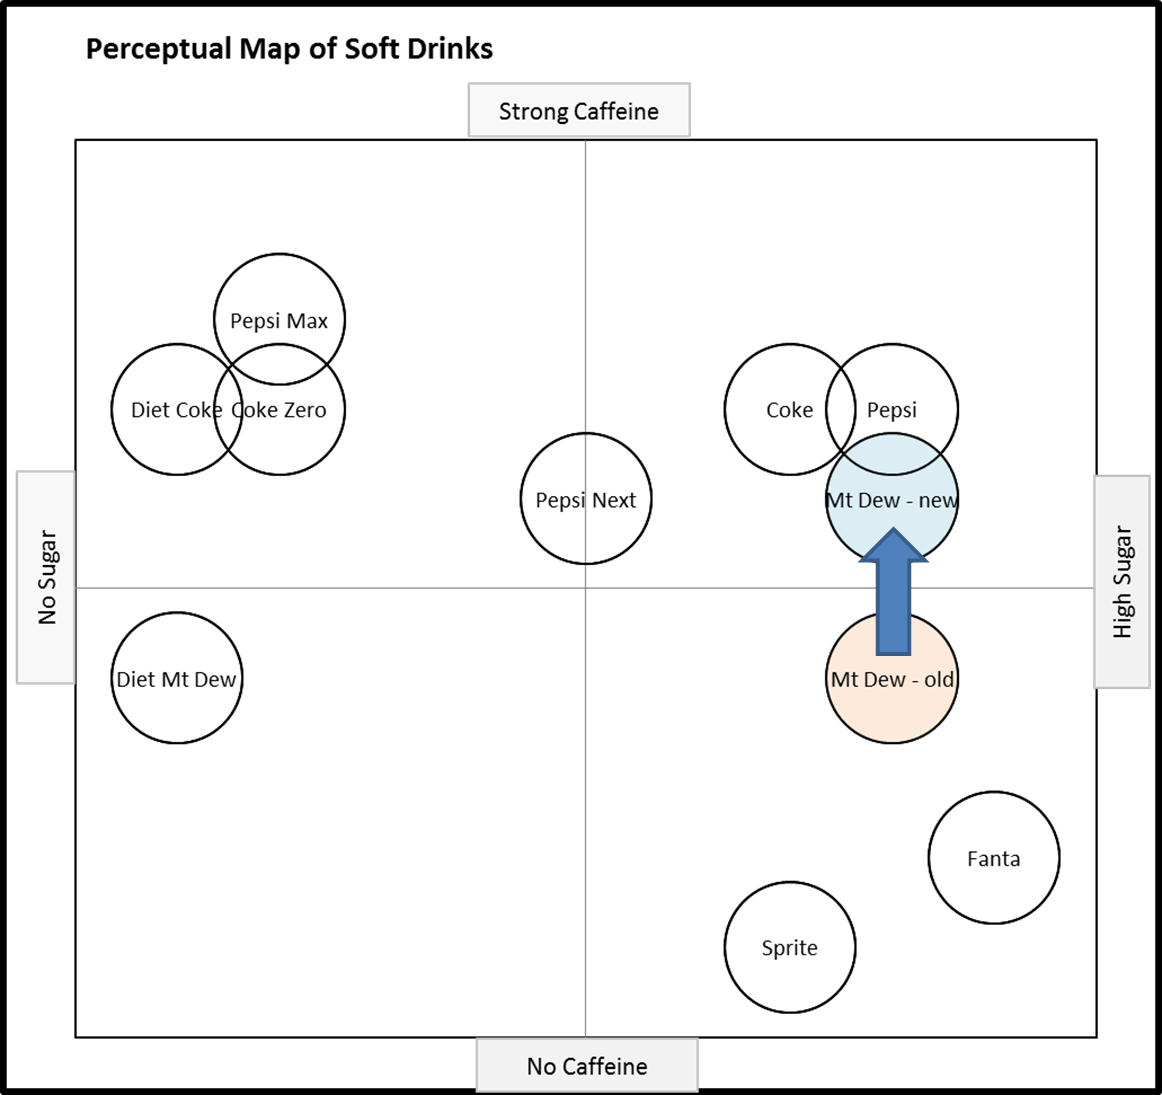
5 = Make Sure You Use Time-based Perceptual Maps
If you work for a larger organization or an organization that conducts greater market research, then it is likely that you have many years of image and positioning data to utilize.
This enables you to compare consumer perceptions over time, perhaps yearly or even more often. By doing this we can compare prior consumer perceptions to today’s perceptions. And you can also map your future positioning intentions.
Adding time-based perceptions gives us a good insight of how our brand is performing, especially as compared to our marketing efforts are performing. Are we delivering on our brand positioning goals?
This method also helps us identify competitive strategies. By mapping perceptions across time, we can see that competitor A were positioned well on X and Y attributes, but now they are better positioned on X and Z attributes.
Then we can dig into why. This is giving us tremendous insight into how they want to be positioned, and then we could drill down to what marketing mix elements have they done, how they changed, what is driving that positioning?
Here is an example of a simple time-based map, where Mt Dew has repositioned upward.
6 = Make Sure You are Realistic with Positioning Goals
As a marketing lecturer, I often see students present a “too ambitious” perceptual map, especially for new entrants to market. They plot a new player in the best position on the map – leapfrogging all established players in one swoop.
Think about it – these competitors have been in the market for a long time and have known and established brands. And we’re a new entrant and we’re going to walk in immediately surpass their positioning?
That’s just unrealistic. The brand is new to this market, whereas the other players may been there for decades. That’s just not realistic, UNLESS you are a major company with a lot of resources and an established and strong brand.
But, for most businesses, it just not possible. So please be realistic if you’re setting positioning goals, particularly when entering a new market or trying to reposition.
Here is a copy of the perceptual map used by Steve Jobs when he announced the very first iPhone back in 2007. A bit unrealistic, but this is Apple after all.
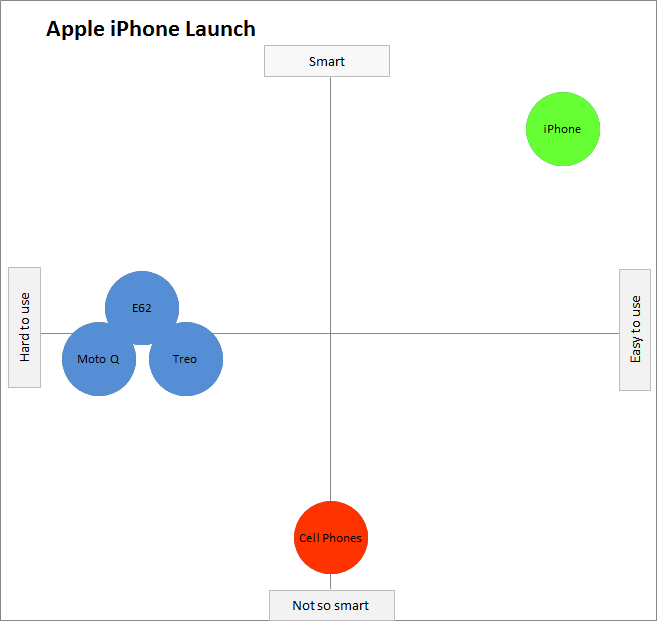
You can learn more about the iPhone perceptual map here iPhone Launch Perceptual Map
7 = Make Sure You NEVER Use Price and Quality on the Same Perceptual Map
For some reason, perceptual maps built on combining price and quality are common on the internet and even in some marketing textbooks. These are poor maps and are not helpful at all for marketers.
Why? Let’s take a look at the following map. What does it tell us? Answer = nothing at all, its a useless map.
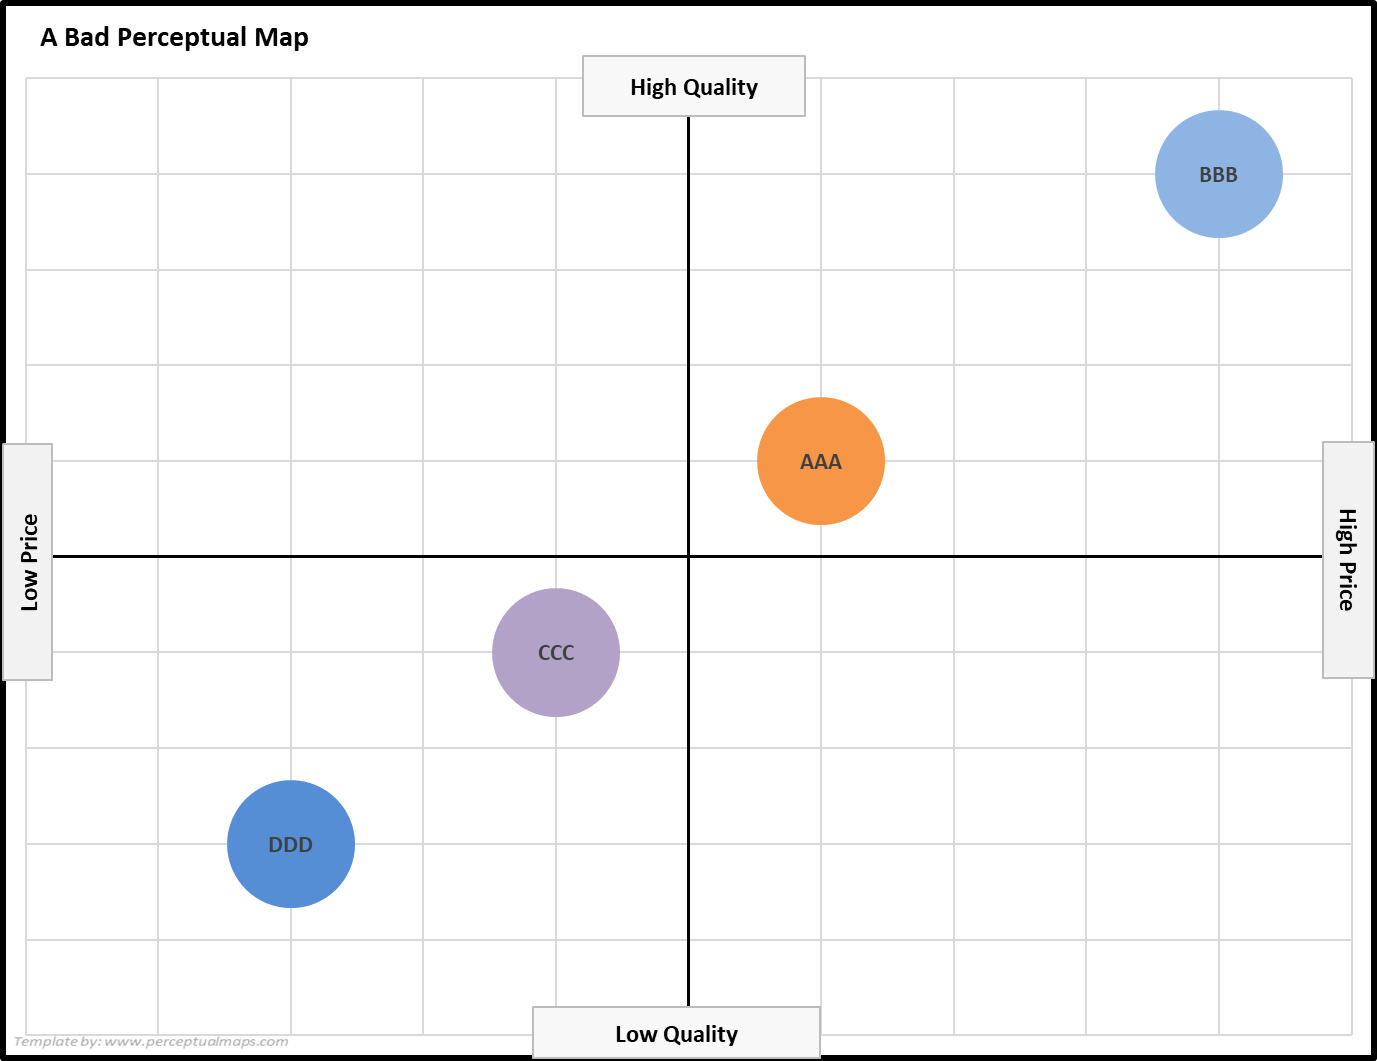
As you can see there is a correlation (pattern) of brands running diagonally on the map – as would be expected when using price and quality.
This pattern occurs because many consumers interconnect price and quality in their minds.
For example, if you ask them, “On a quality scale, you know, one being low quality, nine being high quality, how would you put BMW or Mercedes?”
Most respondents would rate these brands towards the higher quality number because they know they’re higher priced. And if you ask them to rate a cheaper car brand, they’ll go down the end because they’re equating price and quality.
Whenever we use price and quality together we’re essentially mapping the same attribute twice. You can find out more at NEVER Use Price and Quality on Any Perceptual Map
8 = Make Sure You Use Consumer Data, Not Management Opinions
Access to real consumer data will get down to the size of the company and their ability to get research and data. But in larger businesses, you should be building perceptual maps using data on how consumers see the market.
That’s what a perceptual map is designed to do – it maps the perceptions of consumers. How consumers see the market, rather than how we see the market.
By opinions I am referring to those times when we sit around a management table and say, “I think brand A’s position there, and brand B’s position there.”
That’s just guessing – we want to know the perceptions of consumers, not our guesses – and the only way we can map REAL consumer perceptions is by using real-life data.
9 = Make Sure You Remove Brands Always in the Middle of Maps
As we go through looking at multiple maps and we see that one or two brands ALWAYS sit in the middle of every map for both dimensions, you know what that tells us? It tells us that nobody knows anything about that brand.
For example, if a consumer is asked on a scale of 1 to 5, “Tell me about Brand C. Are they high or low on that attribute?”
“Oh, probably a three”, they answer.
And they run through all the brands, come to that another attribute, “Tell me about that brand again.”
“Probably a three”, they answer yet again.
The consumer is going to the middle each time because they have no general understanding of the brand.
So, if you’re finding that happening, take that brand out on ALL the maps. It’s an under-positioned brand, nobody knows much about it.
If you include it in the map, it appears that it’s deliberate and it’s intentional, and you may even make comment, “They have taken this middle map positioning”, which is an incorrect statement.
Here is an example of an under-positioned brand – remember they are in the middle of all maps you review.
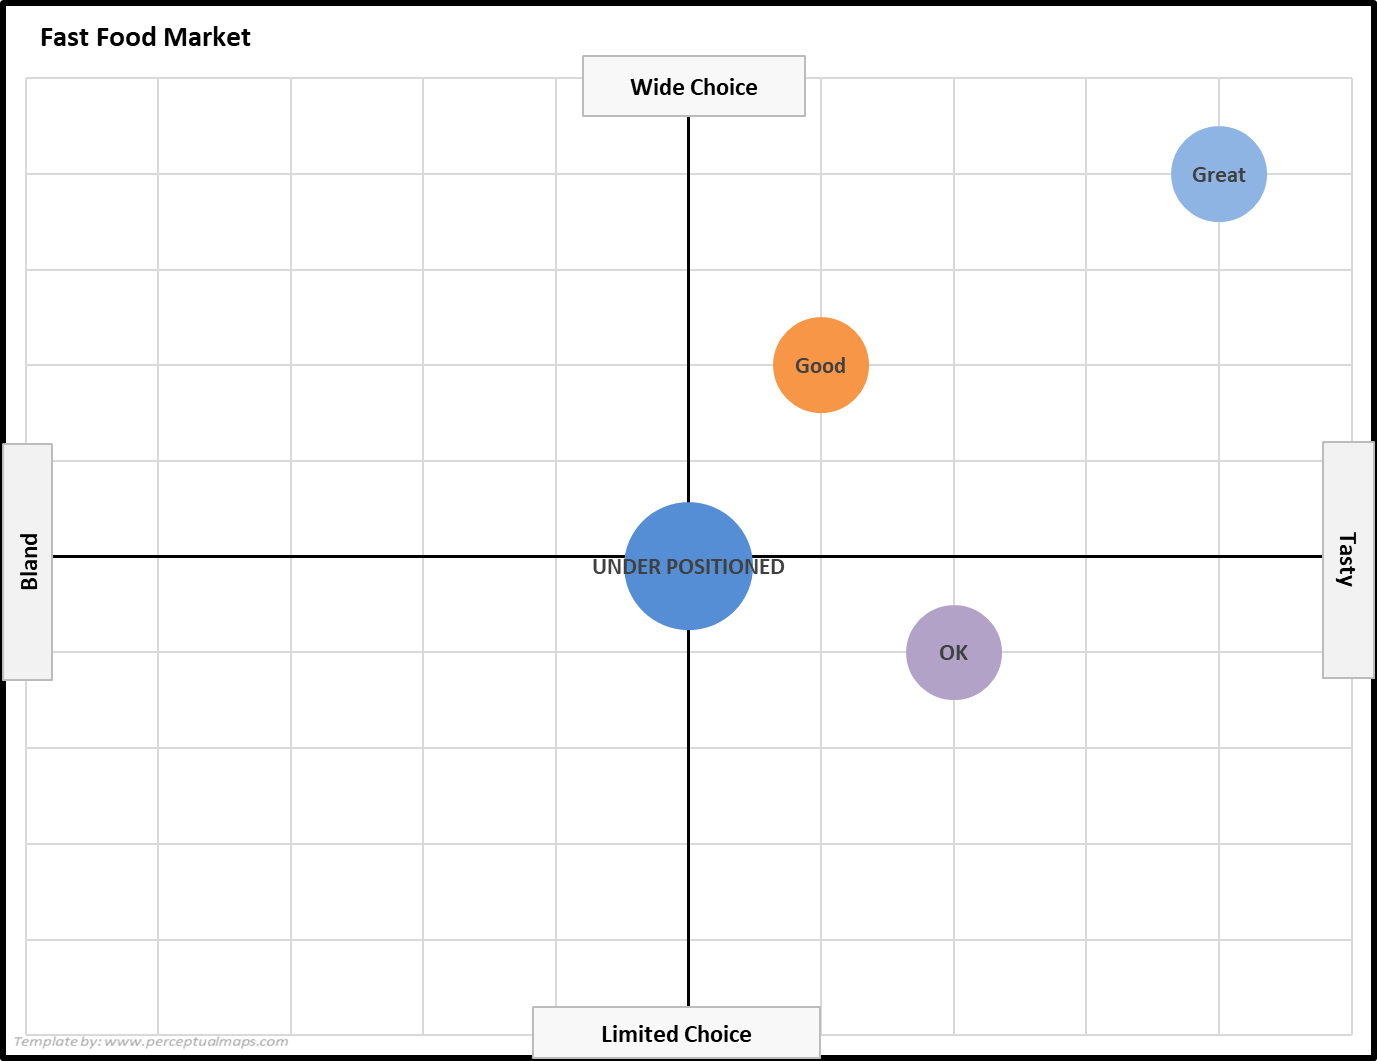
You can find out more at What is Under Positioning in Marketing?
10 = Make Sure You Always Use Excel
I’ve seen students and even businesses trying to do perceptual maps in Word and in PowerPoint. If we’re using data, obviously we have to use Excel. Excel can be quite exact, and here is a link for you to download my free Excel template that allows you to do that so quickly and easily.
Honestly, I don’t know why anybody would bother with Word and PowerPoint. You do it in Excel, you then once you’re happy with the map or maps, you just simply copy it, paste it into your document, and you know it’s exact.
11 = Make Sure Use Other Perceptual Mapping Tools
Standard two-attribute perceptual maps are great – they are both powerful analytical tools, but also simple visualization tools as well.
But while you’re here at Perceptual Maps for Marketing, please advance your positioning and perceptual mapping knowledge by checking out these other great tools:
- Multi-Attribute Perceptual Maps
- Overall Similarities (OS) Perceptual Maps
- Make 100’s of Perceptual Maps Really Fast