Contents
- 1 My Top 12 Tips for Using Perceptual Maps
- 1.1 Tip 1 = Use Lots of Perceptual Maps
- 1.2 Tip 2 = Question Market Gaps
- 1.3 Tip 3 = Use Maps to Help Guide Our Brand Positioning
- 1.4 Tip 4 = Maps to Help Guide Repositioning Goals
- 1.5 Tip 5 = Assessing Our Marketing Performance
- 1.6 Tip 6 = Analyzing Competitors
- 1.7 Tip 7 = Monitoring New Entrants
- 1.8 Tip 8 = Reviewing Indirect Competitors
- 1.9 Tip 9 = Segmentation Analysis
- 1.10 Tip 10 = Impact of New Products
- 1.11 Tip 11 = Identify the Consumer’s Determinant Attributes
- 1.12 Tip 12 = Match Perception and Reality
Want to More Out of Your Perceptual Maps?
Of course you do… In this article I’m going to outline my top 12 tips for analyzing and using perceptual maps.
Hopefully, this guide will come in handy for you. Please note that in this article I’m only looking at this standard two-axis perceptual map, which no doubt, you’ve used before.
Here is a simple example of a two-axis perceptual map…
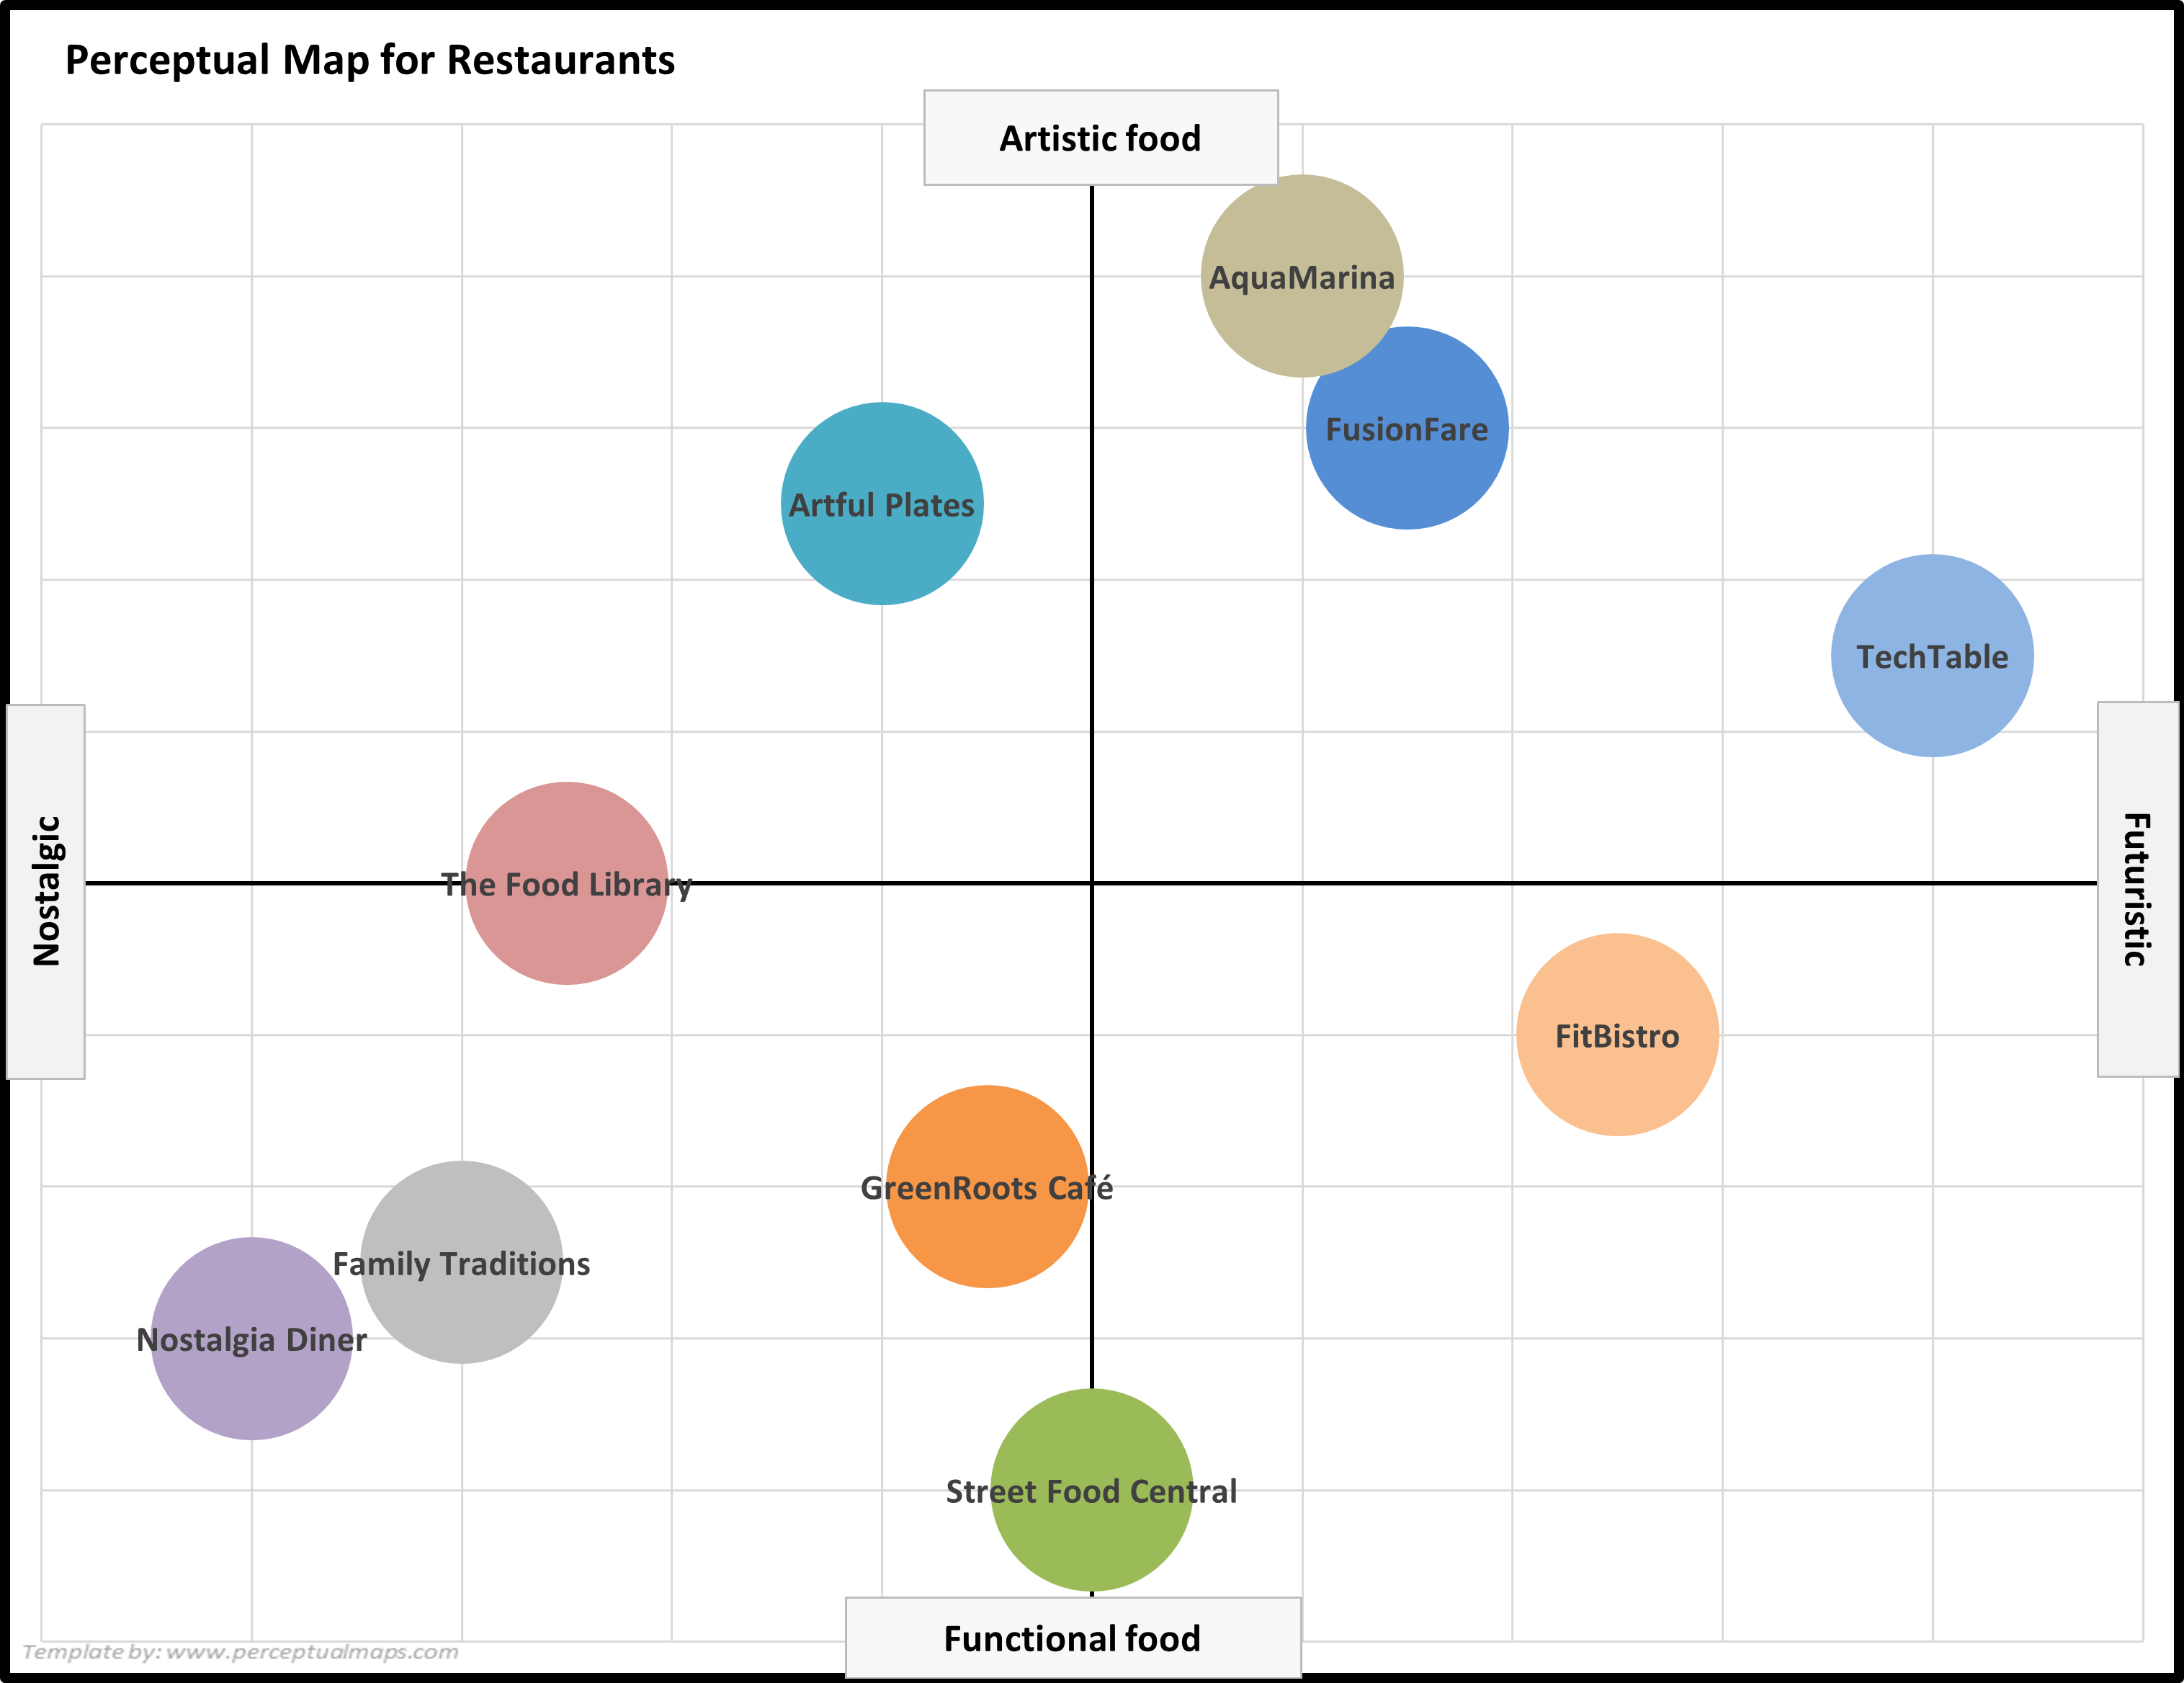
For more information on this perceptual map, please review: Example Perceptual Maps for Restaurants
In most cases, to have this map we will need data from a consumer survey that asks brand image, positioning, and brand distinctiveness questions.
Real data is a great starting point because the maps are reality-based and a real reflection of the marketplace, as opposed to management’s estimation of consumers’ perceptions of the competing brands.
Keep Reading Below for My Top Tips or Watch the Summary Video
My Top 12 Tips for Using Perceptual Maps
Tip 1 = Use Lots of Perceptual Maps
The first thing that we need to do is to construct and review lots of perceptual maps.
If we have undertaken a market research survey, then we’ve:
- spent a lot of money
- asked consumers a lot of questions
- and got a lot of data.
So, let’s not just go, “Oh well, I think we’ll use this map, with that attribute and that attribute combined.”
And while that may be a good start, that’s only just one map. We didn’t need to undertake such an extensive brand image survey to reduce simply one perceptual map.
This means that we keep going through all the image data and relevant attributes and aspects of segmentation (see additional tips below) and keep constructing various perceptual maps to analyze.
The combination of various maps will create a very strong picture and understanding of the marketplace, and we will get a good sense of where all the brands are perceived by various market segment consumers. No doubt, we will identify several market insights that we did not have before if we crunch through dozens of perceptual maps.
And while this may sound like a little work, please note that I have a very efficient perceptual map template that enables you to construct and analyze 100s of maps in one analytical session.
To find out more, please review… Really Fast Perceptual Map Template
Once we start looking at multiple maps, we’re end up getting out of our own mindset. That is, we stop relying upon our view and understanding of the market and its key players.
While I understand that we are all experienced marketers in our industry, which means that we have strong knowledge about competing brands, but this perceptual information is fresh information and will help us deepen our understanding of the market.
In other words, it’s going to give us better insight and better understanding, especially if we run lots of maps, rather than relying on two or three standard maps that we have always used.
Tip 2 = Question Market Gaps
As you most likely know, a common outcome of using perceptual maps is to identify gaps in the marketplace. These gaps are often product positioning based. That is, a combination of attributes (or attribute levels) that do not appear to be offered by competitors.
Often, these marketplace gaps feed into our product line extensions, our new product process, and maybe even our communications and revised brand positioning.
But we need to take care and question these market gaps. Is there a logical reason for this gap or is it a valuable neglected opportunity?
As you most likely know, sometimes these market gaps are not viable – and that’s why there are gaps and no competitors in that space.
This may happen because there’s no underlying demand or very little underlying demand. This creates a very niche market, which is unlikely to be viable for us.
Or alternatively, it could be too expensive to construct such a product with a combination of these attribute. Therefore, it’s very important really understand:
- Why is that gap there?
- Why has nobody else gone into it?
- Why are we the first ones to see this?
And if it makes sense, yes, go chase it, go after it. But just step back for a moment and go, “hmm, competitive marketplace, nobody’s in that space – why is that the case?”
And often some sort of history lesson going back into the market, seeing if similar products have come to market in the past, could be helpful when assessing the viability of opportunities presented by market gaps.
Tip 3 = Use Maps to Help Guide Our Brand Positioning
Now let’s look at strategy execution.
In terms of brand positioning, most brands will go for an empty space that has an underlying consumer demand.
That means we want clear, distinct positioning, which we call differentiation, as you know.
In other words:
- Where are we unique?
- Where do we stand out?
Most positioning is built around targeting “empty” space, and, as a result, having a clear point of difference.
This means that there’s no other brands with a perceived similar offering. And we actually want to be almost like a monopoly in the marketplace.
So, consumers go, “I want a product that does this or provides that benefit. Oh, it’s that brand. That’s the only solution.”
To be the “only solution” is often considered to be the ideal positioning. But there are other positioning strategies too.
For example, we can “crowd” a competitor. If a competing brand is in our ideal positioning space, then we can introduce multiple products around it with similar (or identical) positioning to start attacking their market share.
And not just one product but maybe two, maybe three. Over time, although expensive, this will deteriorate their competitive position, hopefully to the point where that competitor goes, “Well, this positioning now is too competitive. There are all these competitors. Let’s reposition into a more viable space.”
So, if you want to own something, and there’s a competitor there, you can disrupt their business for a while.
The opposite of crowding them out, is copying their positioning.
If you are a smaller brand up against a large brand that is doing quite well, then you might be content to have a similar offering, a similar positioning, maybe price a little bit cheaper,
That way you’re going to pick up a small piece of the market share. You know, we’re going to pick up a piece of that 40%. Sure, the larger brand has got greater customer, probably a superior product – but if you can pick up a piece of that market share, that probably would be quite viable for a small player.
As you can see, there are different positioning strategies to consider:
- being unique
- targeting gaps
- crowding/disrupting a competitor, or
- copying a major competitor
Tip 4 = Maps to Help Guide Repositioning Goals
Perceptual maps can also help us with our repositioning goals from time to time, particularly for:
- older brands
- brands that have been overtaken by competition or technology
- where consumer needs have changed, or
- there’s been a shift in target market.
This means that from time to time, we’re going to want to reposition our brand and perceptual maps will help us understand how we need to reposition.
And as a reminder, in our positioning analysis we’re going to be looking at lots of maps which means that we will have a lot of information about how and where we should reposition.
Tip 5 = Assessing Our Marketing Performance
This is probably the most important tip in this article – using perceptual maps to identify how effective marketing and branding efforts had been.
In other words, we can use perceptual maps to gain an overall assessment of our brand management.
Obviously, we have lots of financial and marketing metrics that can also assist us, but if we can have a look at various perceptual maps from 1-2 years ago and compare them to today’s positioning, this will be very helpful information.
It is even more important if we have heavily invested into brand building or brand positioning. The changes our positions in the various perceptual maps can tell us (and tell management) that our branding efforts have been successful, and we now have a stronger competitive position in the market (hopefully anyway).
This is a form of non-quantitative justification of our marketing spend and our marketing performance. While senior management are often more concerned with short-term sales and profitability, many of them will understand the importance of a strong underpinning brand that will deliver strong profitability for many years to come.
Creating a highly competitive and distinctive brand positioning is fundamental to the marketing success in many industries.
It also enables us to compare our changing positioning (or our consolidation of positioning) against our key competitors and determine changes in our relative strengths and weaknesses.
This means that perceptual mapping can add to our suite of marketing analytics, by providing a visual representation of our evolving (and hopefully stronger) competitive brand position.
Generally, we would assess our brand positioning in conjunction with our top-level sales and financial metrics. We would naturally expect there to be a relationship between them – that is, improved brand positioning = improved market share and profitability.
Alternatively, if our brand position has eroded, perceptual maps will help us identify where our weaknesses lie, or where competitors have exploited opportunities.
From time to time, we will find ourselves in a situation where we have invested in brand awareness and/or revise positioning and spent a lot of money, but it really hasn’t delivered anything.
While this is not a great outcome, it is still very helpful information for going forward. It just means that our communication strategy (or our revision of the marketing mix) is not helping us achieve our brand goals, so we need to rethink what we’re doing. So, either way, good news or bad news, is very helpful information for us as marketers.
Tip 6 = Analyzing Competitors
In the same way that we analyze our own brand, we can analyze competitors the same way.
We can look at key competitors over time as well. This enables us to identify what competitors are trying to do, where are they trying to position or reposition, what is their new product strategy and so on.
And then we can dig more deeply into HOW they have revised or strengthened their market positioning. We could look at their marketing mix now versus last year and even the year before and see what’s evolving.
By review what’s happening with their product and pricing and their other marketing mix elements, we can gain tremendous understanding of the marketplace.
We can see from what they’ve done, not just what we’ve done, but what they’ve done, what works, how it works.
And when we go to spend marketing money, not only do we have our lessons to learn from, but we have our competitors. They have put their money at risk. It may have worked, may not have worked.
And this makes it important to look at both competitors who have improved their positioning and competitors who have eroded their positioning and work out:
“Okay, what are the dimensions that trigger a good position or a good reposition? And which is the one marketing mix element doing the opposite?” That’s very handy information but as you can see, we need to start integrating marketing information and combining analytical tools.
In this case, we are connecting the perceptual outcomes to the other information that we have, and we keep digging into how the market works, how consumers are responding, what competitors are doing.
Tip 7 = Monitoring New Entrants
In addition to analyzing existing competitors, perceptual maps are very handy for monitoring new entrants and players in the market.
Typically, when new companies come in, they see an opportunity. They want to do things differently, they want to come in with points of difference.
They think there’s chances for them to grab market share, take it away from the existing players, potentially grow the market.
So, they’re quite interesting to have a look at about what they’re doing and how they approached this market.
They don’t have the same brand background, they don’t have the reputation, the customer loyalty. They may not even have the logistics and manufacturing and whatever infrastructure, depending on the industry. So, they’re at a number of disadvantages, but they have an advantage because they’ve thought of a new way of competing.
Tip 8 = Reviewing Indirect Competitors
One of the dangers and limitations of using perceptual maps is that we often limit our analysis to direct and well-known competitors. This is a risky limitation as brands are often challenged by indirect (substitute) products from outside product category.
When you think about it, consumers are seeking solutions for their needs or problems – they are not seeking specific products in most cases – so their product solutions are not limited to our brand and our competitors.
For example, for the fast-food industry, in addition to going to a direct competitor, consumers could also go to a restaurant, they could go to a café, they could go to a vending machine, they could go to a supermarket, they could eat at home.
There are lots of choices when somebody needs the convenience of a quick meal. And if we look at our industry only (fast-food) we are not going to consider all of these substitute (indirect competitors) players.
They are important because when a company starts to see eroding sales or revenue, it’s either one of two things:
- it’s direct competition that’s stealing market share or
- it’s a new industry or an indirect competitor that is eroding into the overall product category.
Therefore, by mapping and watching indirect players, we’re going to have a much stronger understanding of how robust our product category is and how we protect our position.
Tip 9 = Segmentation Analysis
We can use perceptual maps to not just look at the overall market, but drill down to different segments as well.
And this analytical approach can be based upon a segmentation structure that we haven’t used before. While we may have a standard segmentation approach and a clear target market, there’s no reason we cannot analyze positioning using other segment structures.
Yes, we can analyze by using other segments that we haven’t pursued. Sure, they may not be target markets, but that doesn’t matter for our analysis.
By playing around with our segmentation, to see different segments that we haven’t used before, we may discover new insights by looking at where do we do well and where do we not do well?
We may discover a different way of using psychographic, benefit or behavioral segmentation and find new ways of defining attractive target markets.
And we just play with the data and construct lots of map variations, we might find out that we’re a standout in a segment that we’ve never thought about.
Tip 10 = Impact of New Products
We can use perceptual maps to look at new product success and to help manage our overall product mix.
Obviously, as new products come in, and as products come out or are replaced, we can see how they populate on the various positioning maps. And again, we are just not looking at us, but our competitors as well.
And we can ask:
- Where are they going?
- What are they targeting?
This questioning approach gives us more insight into their strategy.
We can also use perceptual maps to help guide and nurture new products. Most new products are in the support stage or the launch stage of a business for several years.
We just don’t launch a product and go, there you go, good luck with that. We bring out a new product, and we’ve got to nurture it. It’s like a baby, we’ve got to develop it and grow it and support it until it becomes a profitable product in its own right.
And early on, this allows to assess whether we’re on track for our intended positioning.
Tip 11 = Identify the Consumer’s Determinant Attributes
Let’s talk about the key decision attributes, known as determinant attributes.
As we’re going to be analyzing multiple maps and rotating and changing all the attributes we have onto different maps, we should be able to identify the key decision-making attributes.
This will happen through a comparison of our maps and key in-market data, such as market shares.
For example, we can go through and find an unusual map where the brand positions and configuration are quite different. Then we match that back to market shares. Does it match? Does it tell a story?
What we are looking for are maps that reflect the market share picture as well. This approach can provide us with insights into the attributes that consumers use in their purchase decisions – the ones that are driving sales behavior.
Hopefully, this will help us identify foundational (or a combination of two or three) attributes that are connected to sales results.
These attributes are most likely determinate attribute = which are the ones that determine the consumer’s choice.
Tip 12 = Match Perception and Reality
Finally, we can look at the connection between perception and reality.
While could go through and “technically” analyze products and say, “our product is superior because it has better ingredients, or it’s got better technology”.
But that’s reality, not perceptions. With perceptual maps, we want to map perceptions.
But if we compare perceptions and reality, we will most likely find gaps – sometimes in our favor, or sometimes in the competitor’s favor.
This gives us an opportunity to say, “okay, we’re not being effective in our communication, as our product is better than that. We need to improve our positioning.”
Key Takeaways
Perceptual mapping is an important part of marketing analytics, providing a visual representation of our evolving competitive brand position and enabling us to compare our changing positioning against our key competitors and determine changes in our relative strengths and weaknesses.
Perceptual maps are useful for monitoring new entrants and players in the market, but don’t limit them to direct and well-known competitors only. They can also be used to analyze indirect competitors, as brands are often challenged by substitute products from outside product category.
Remember to use lots of perceptual maps to create a strong picture of the marketplace and identify market insights. Relying on a single perceptual map only provides very limited insight and fails to harness the analytical power of this tool.
Also use the fast perceptual map template to construct and analyze 100s of maps in one analytical session.
Related and Helpful Information
- Positioning Strategy
- Perceptual Maps: Best Practice
- How to Effectively Use Perceptual Maps
- Which Perceptual Map Should I Use?
- How to Get the Most Out of Your Perceptual Maps
- How to Analyze Perceptual Maps