Contents
- 1 Analyzing Perceptual Maps
- 1.1 Question 1 = Is Our Brand Distinctive?
- 1.2 Question 2 = Does Our Brand Positioning Fit the Preferences of our Target Market/s?
- 1.3 Question 3 = How is Our Brand Positioning Tracking Over Time?
- 1.4 Question 4 = How are Consumer Preferences Changing?
- 1.5 Question 5 = Are We Effectively Implementing Our Positioning Strategy?
- 1.6 Question 6 = How Do Our Marketing Decisions Impact Our Brand Positioning and Performance?
- 1.7 Question 7 = How Do Individual Market Segments Perceive Our Brand?
- 1.8 Question 8 = What Other Perceptual Mapping Tools are Available?
Analyzing Perceptual Maps
In this article I will explain the main ways you can analyze a perceptual map, so we get the most value out of it as marketers. In particular, I address these questions:
- Question 1 = Is Our Brand Distinctive?
- Question 2 = Does Our Brand Positioning Fit the Preferences of our Target Market/s?
- Question 3 = How is Our Brand Positioning Tracking Over Time?
- Question 4 = How are Consumer Preferences Changing?
- Question 5 = Are We Effectively Implementing Our Positioning Strategy?
- Question 6 = How Do Our Marketing Decisions Impact Our Brand Positioning and Performance?
- Question 7 = How Do Individual Market Segments Perceive Our Brand?
- Question 8 = What Other Perceptual Mapping Tools are Available?
Please note that you can review the following video or scroll down for the full article.
Question 1 = Is Our Brand Distinctive?
One of the first thing that we are looking for is to see if our brand is distinctive and whether it stands out in the marketplace.
Generally, on a perceptual map, you want space around it; you don’t want to be crowded in by competitors.
If we can achieve this position, then when consumers are thinking about a particular need, we will be the only brand that comes to mind because we are the only brand that offers that combination of attributes or particular benefits.
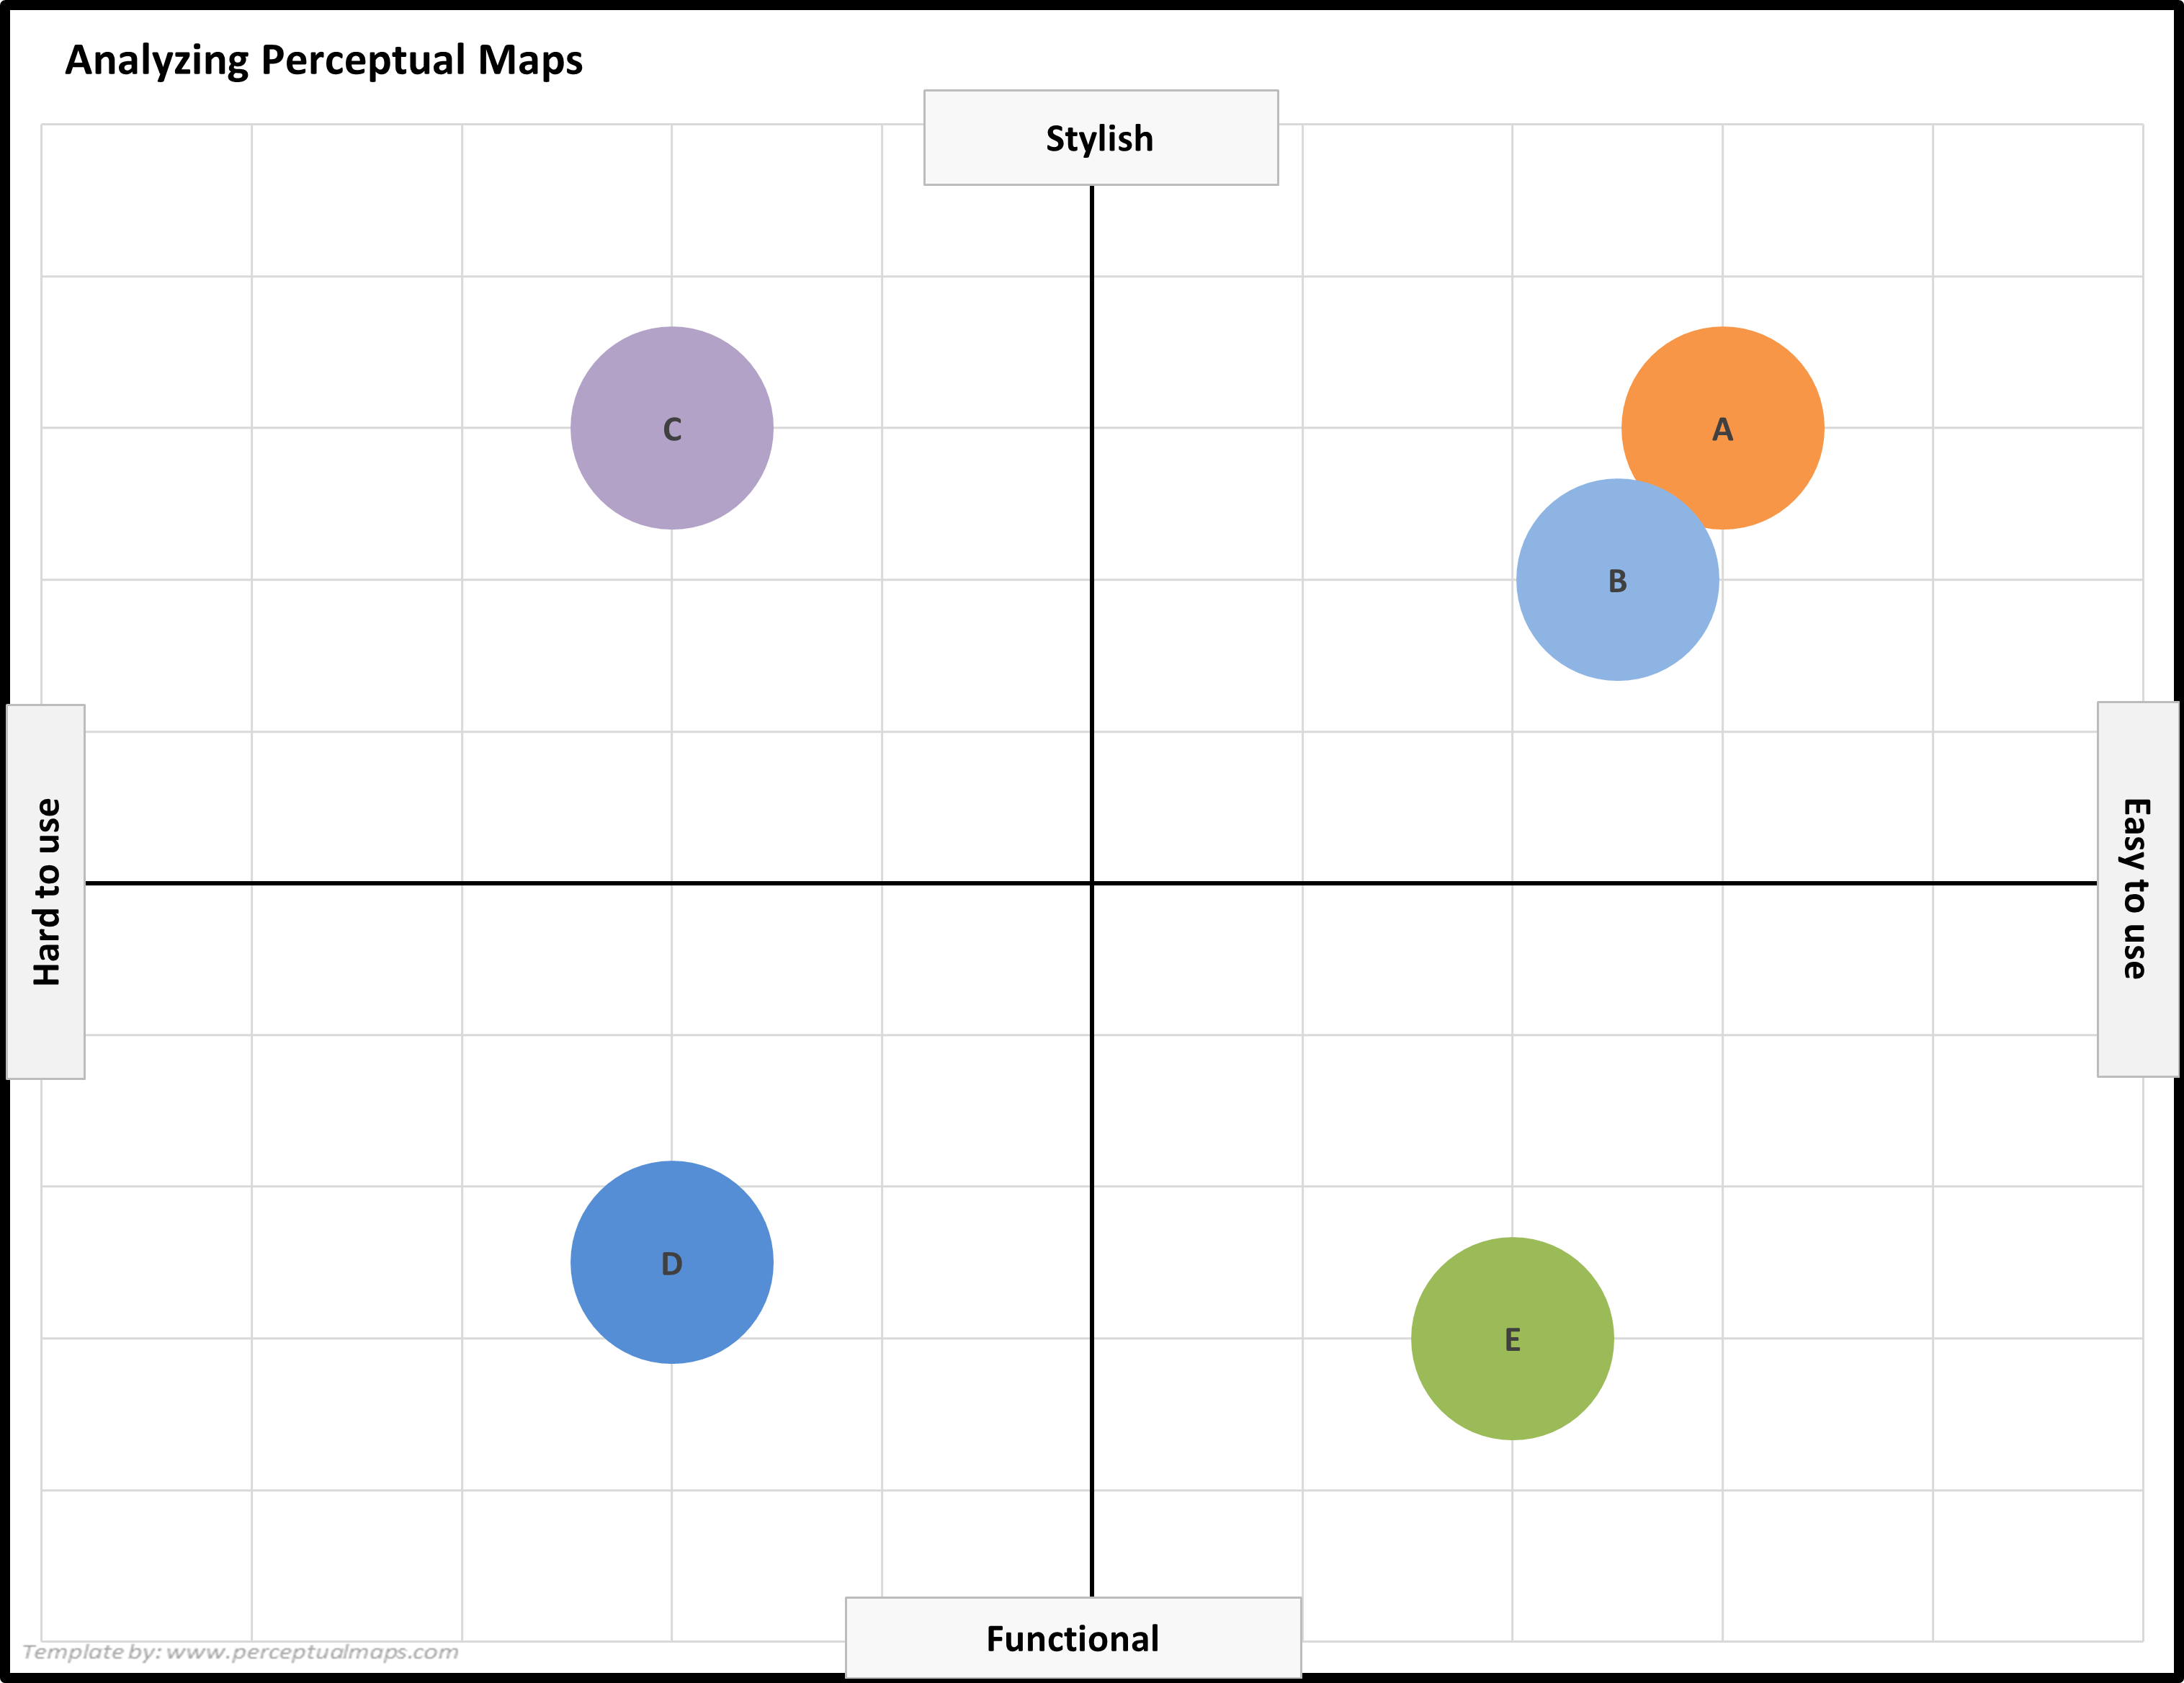
Let’s review an example. In the following map you can see that there are five brands presented. Three of those brands are distinctive (C, D, and E) – because they have their own space are are perceived to be very different to the other brands in the market.
But Brands A and B are not distinctive and are positioned almost identically. In the mind of the average consumer, these brands are essentially the same. This means that these brands will be need to fight for market share between themselves.
Question 2 = Does Our Brand Positioning Fit the Preferences of our Target Market/s?
The next thing we can do is to add in the ‘ideal attributes preferences’ of different market segments. In other words: What are they looking for? What’s the ideal combination of attributes for their needs?
When we conduct our consumer survey, not only should be capture brand image perceptions, but we should also ask respondents, “What would be the ideal attribute level for you?”
For example, if our brand is a snack food, then we can ask (on our scale) how salty or not salty? is their snack food preference.
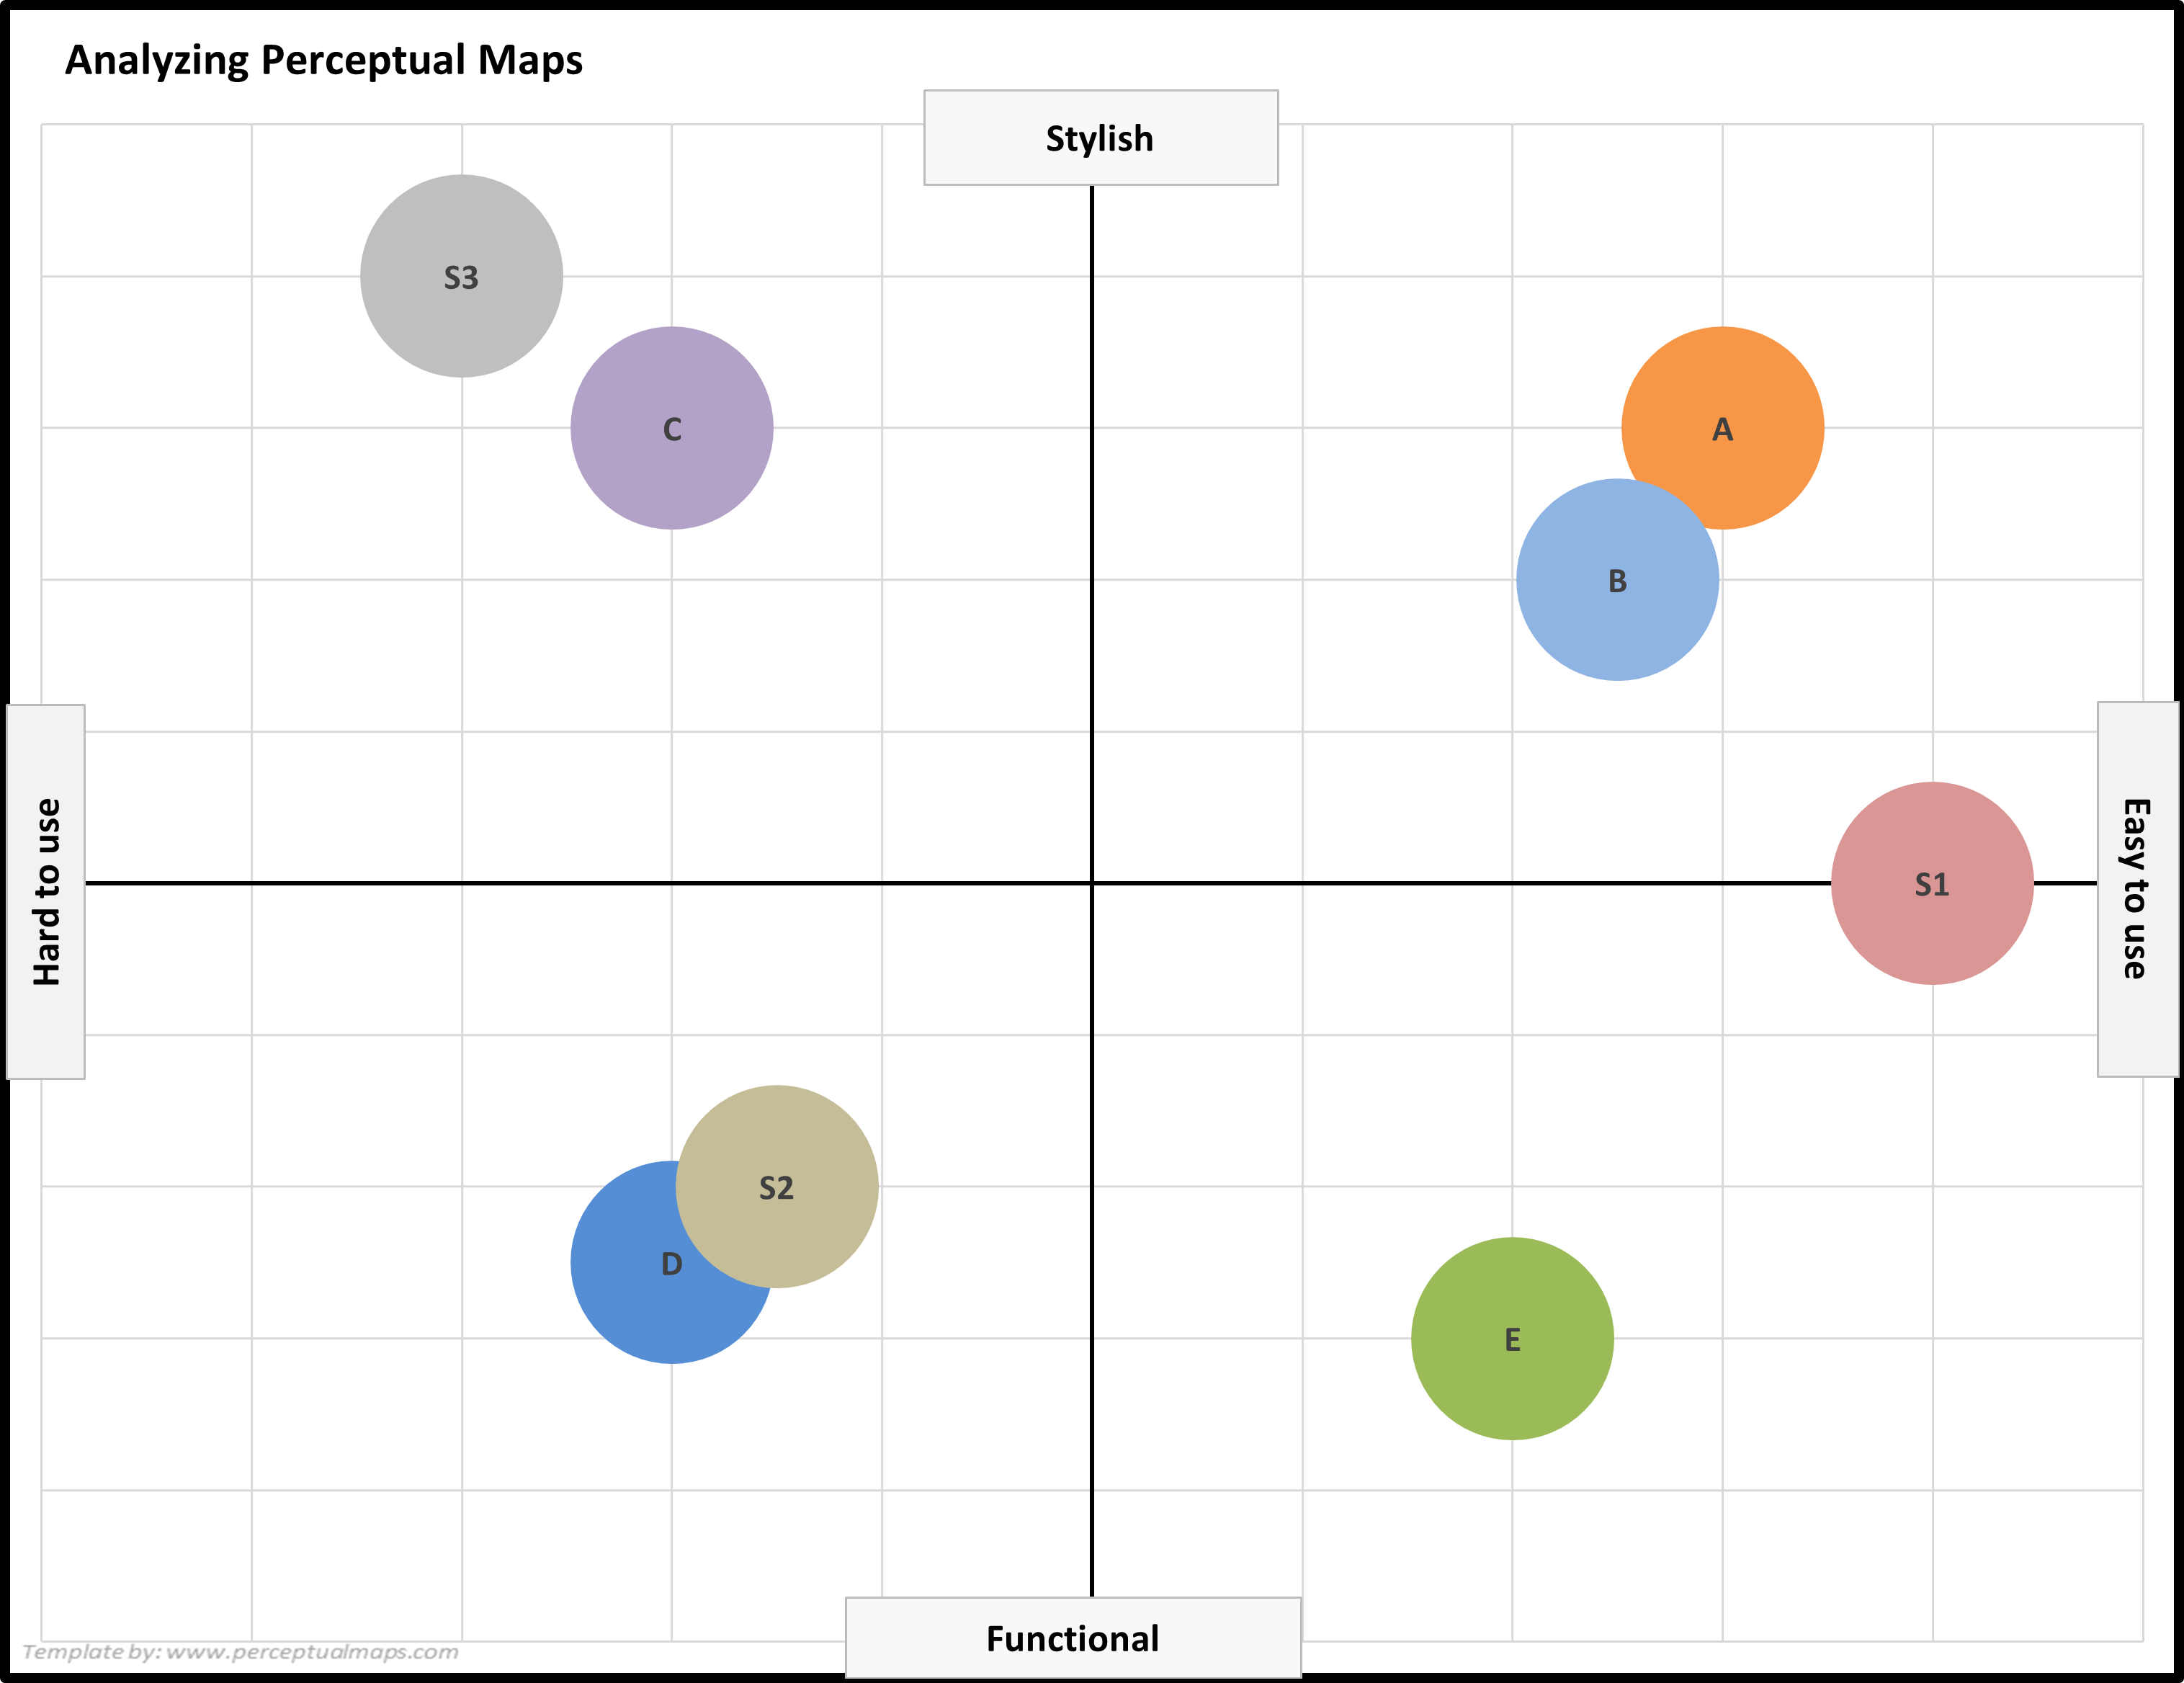
Let’s review another example map below. In this perceptual map I have the same five brands presented again – but this time with the ideal preference of three segments (S1, S2, S3). (Note: Combining brands and segment preferences is referred to as a Joint Space Map).
Now we can see that although Brands A and B are positioned together (giving the impression that there was a lot of market demand in that position), we can now see that they are both quite poorly positioned.
And the two brands that are the best positioned are Brand D (positioned close to Segment 2) and Brand C (near Segment 3). And both of these brands are unique, distinctive, and a good fit to market needs.
The other three brands (A, B, and E) and are ‘vaguely’ targeting Segment 1 – but nobody has got that positioning quite right as yet. This means there is a big opportunity for these brands if they could restructure their marketing mix and reposition appropriately.
Question 3 = How is Our Brand Positioning Tracking Over Time?
We should look at perceptual maps over time, to track changing brand performance. We don’t just want to look at one point in time; we want to see how the brand is developing and evolving.
Again, there is another example map below for us to review and consider.
In this map I have only included Brands A and B – but I have added a time-dimension. For instance, A (= A now)m A-1 (= A last year), A-2 (= A two year’s ago) – and the same for Brand B.
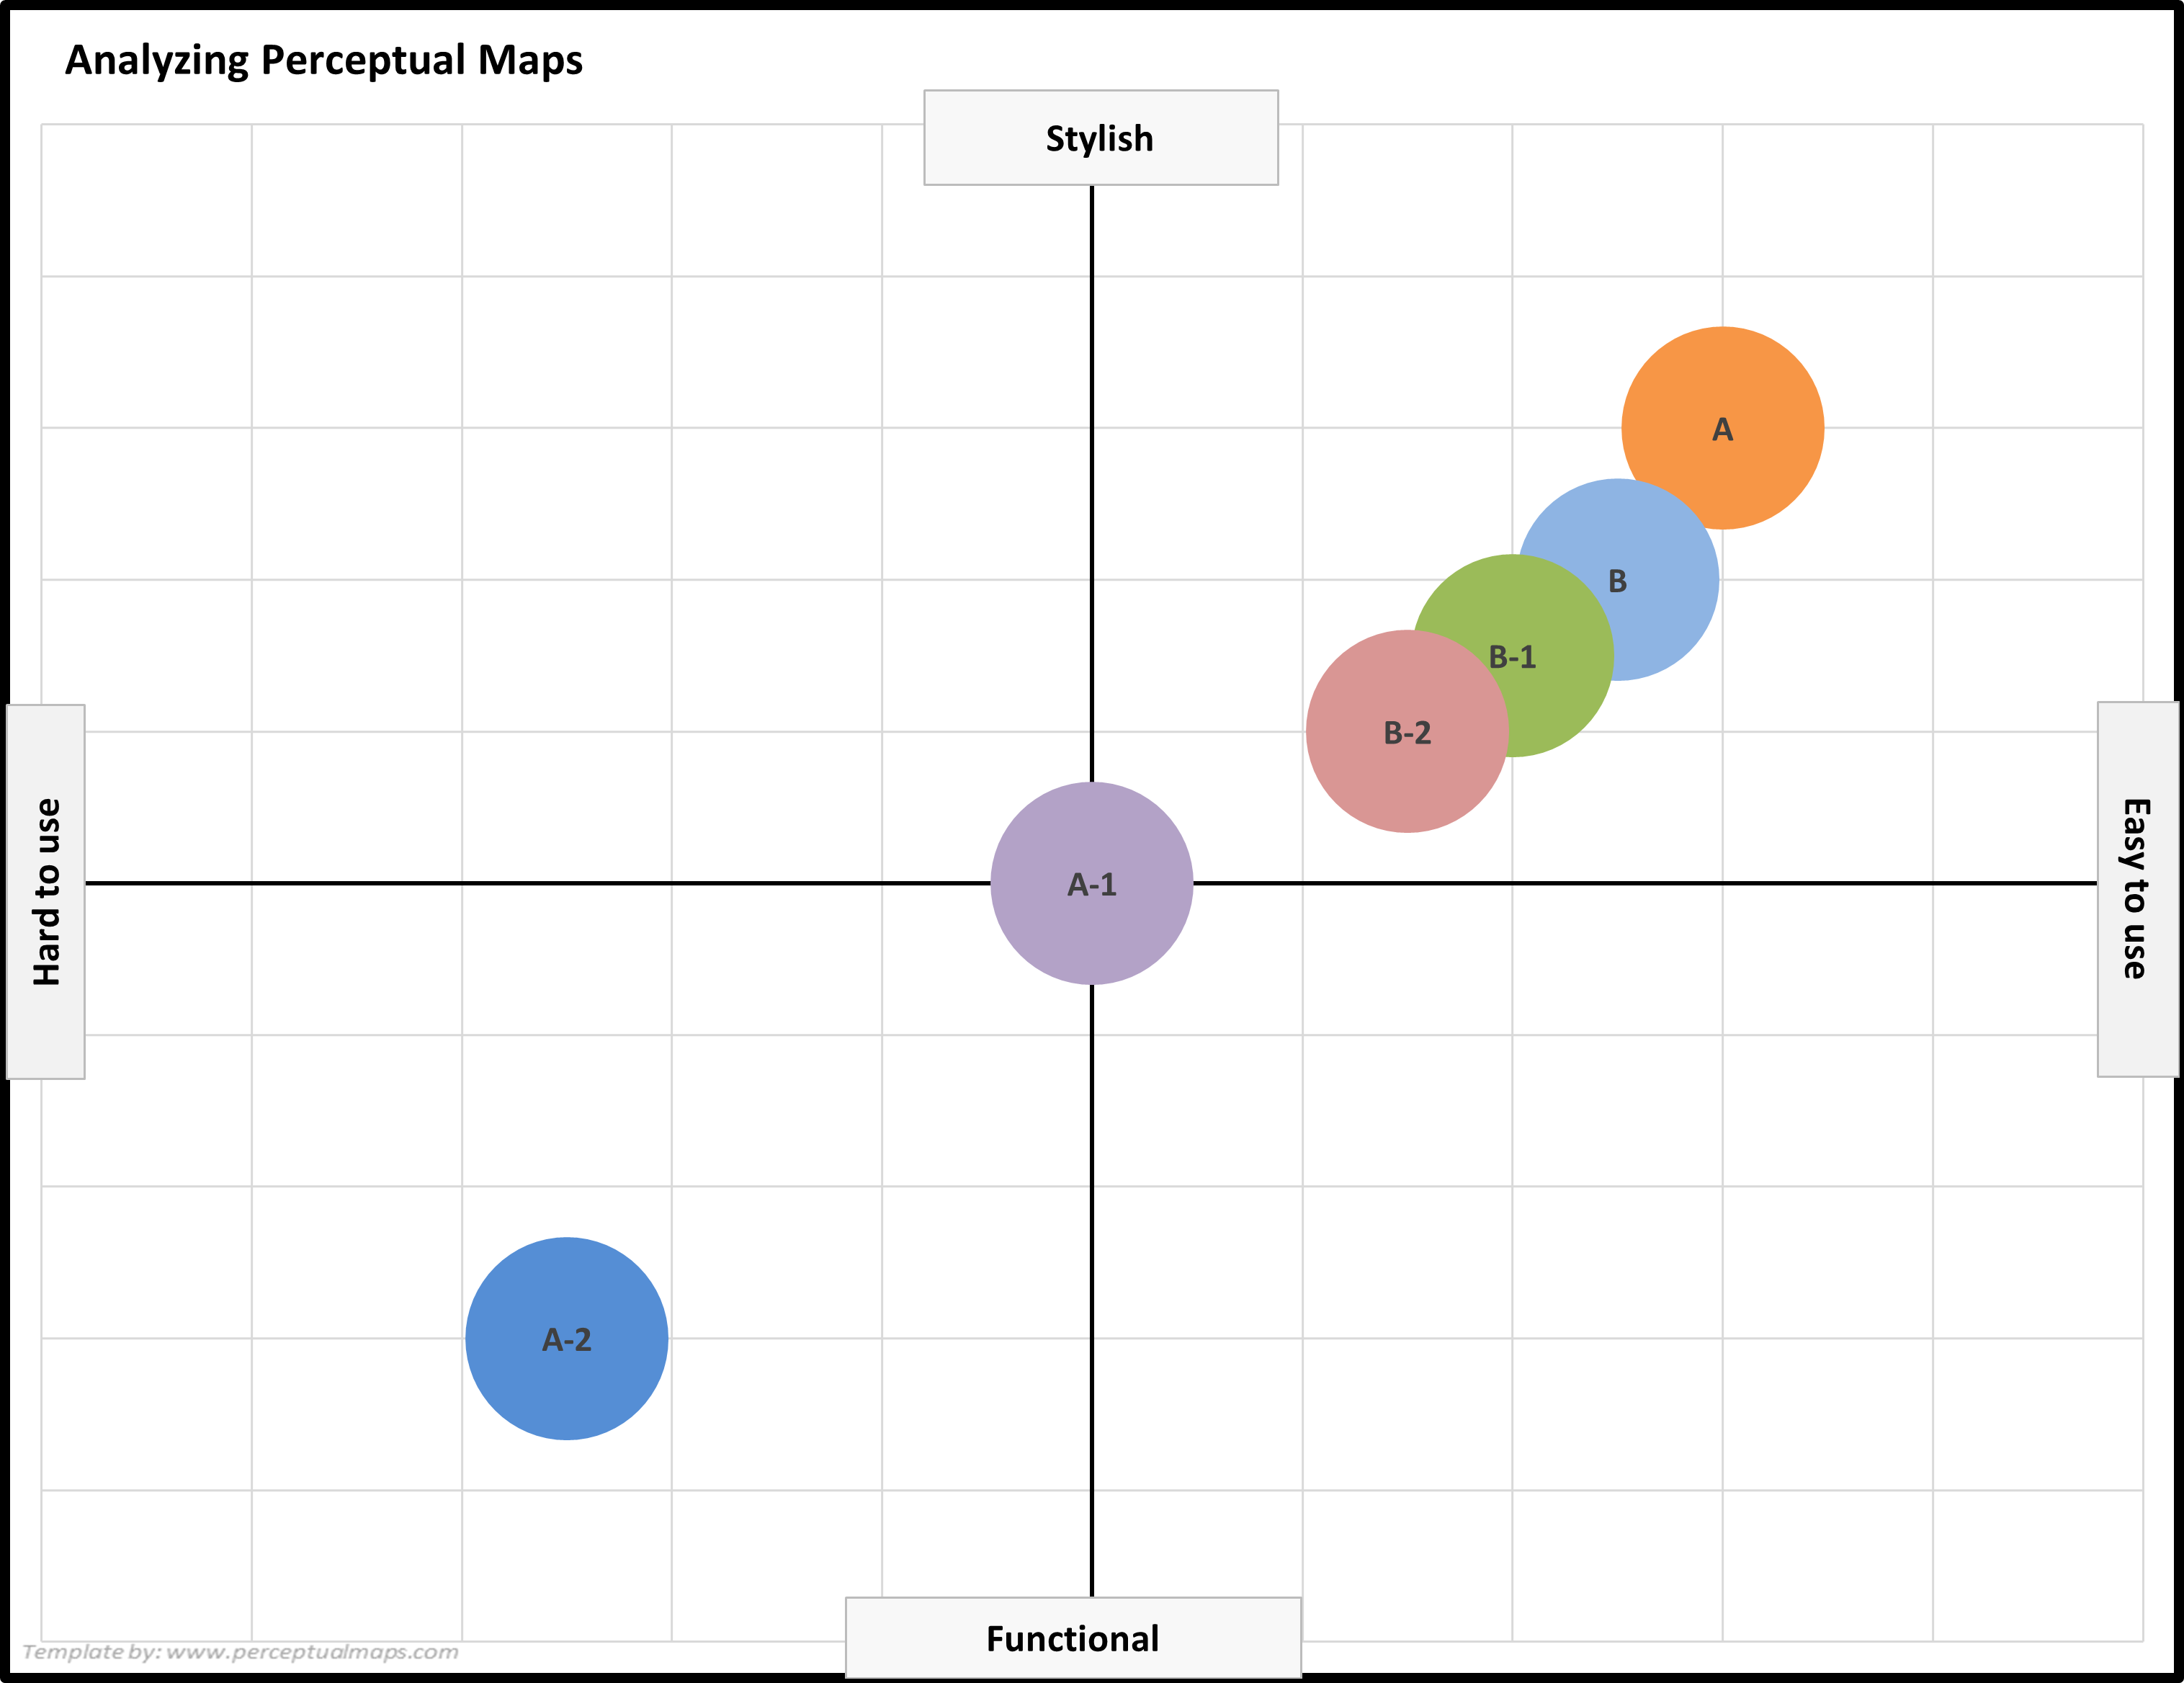
And what can we now see? We can identify that Brand A has substantially repositioned over the last two years. Initially, it had almost the opposite perception (on these attributes) to Brand B – but now it has almost the identical positioning.
And because of speed and direction (toward Brand B) of the repositioning, we can conclude that this was an DELIBERATE strategy. For some reason, Brand A decided to reposition their brand substantially and to directly attack Brand B.
We can also see that Brand B has slowly/progressively repositioned. But this does not appear to be deliberate, and is more likely to be a slow shift in the brands positioning due to its maturity in the market, and its ongoing customer loyalty, and various forms of word-of-mouth support.
Regardless, of deliberate/not deliberate, we can see that time-based maps give us a great insight into competitors, changes in positioning, strategies, and the strengths/weakness of our current positioning.
Obviously, Brand A can also use this map to justify/demonstrate the success of their repositioning efforts. This becomes a qualitative metric for their brand management performance (assuming that their revised positioning was intended and targeted).
Please note that provided we have access to historical brand image data, that these time-based perceptual maps are very easy to construct using the Free Download of the Perceptual Map Template.
Question 4 = How are Consumer Preferences Changing?
Just as we used a time element instructing the above perceptual map, we could also add a time element to monitor the change in segment preferences as well.
As marketers, we know that consumer needs change over time, and their ideal preferences change. Again, if we have access to suitable consumer data, then the changes in the segment preferences become very powerful information.
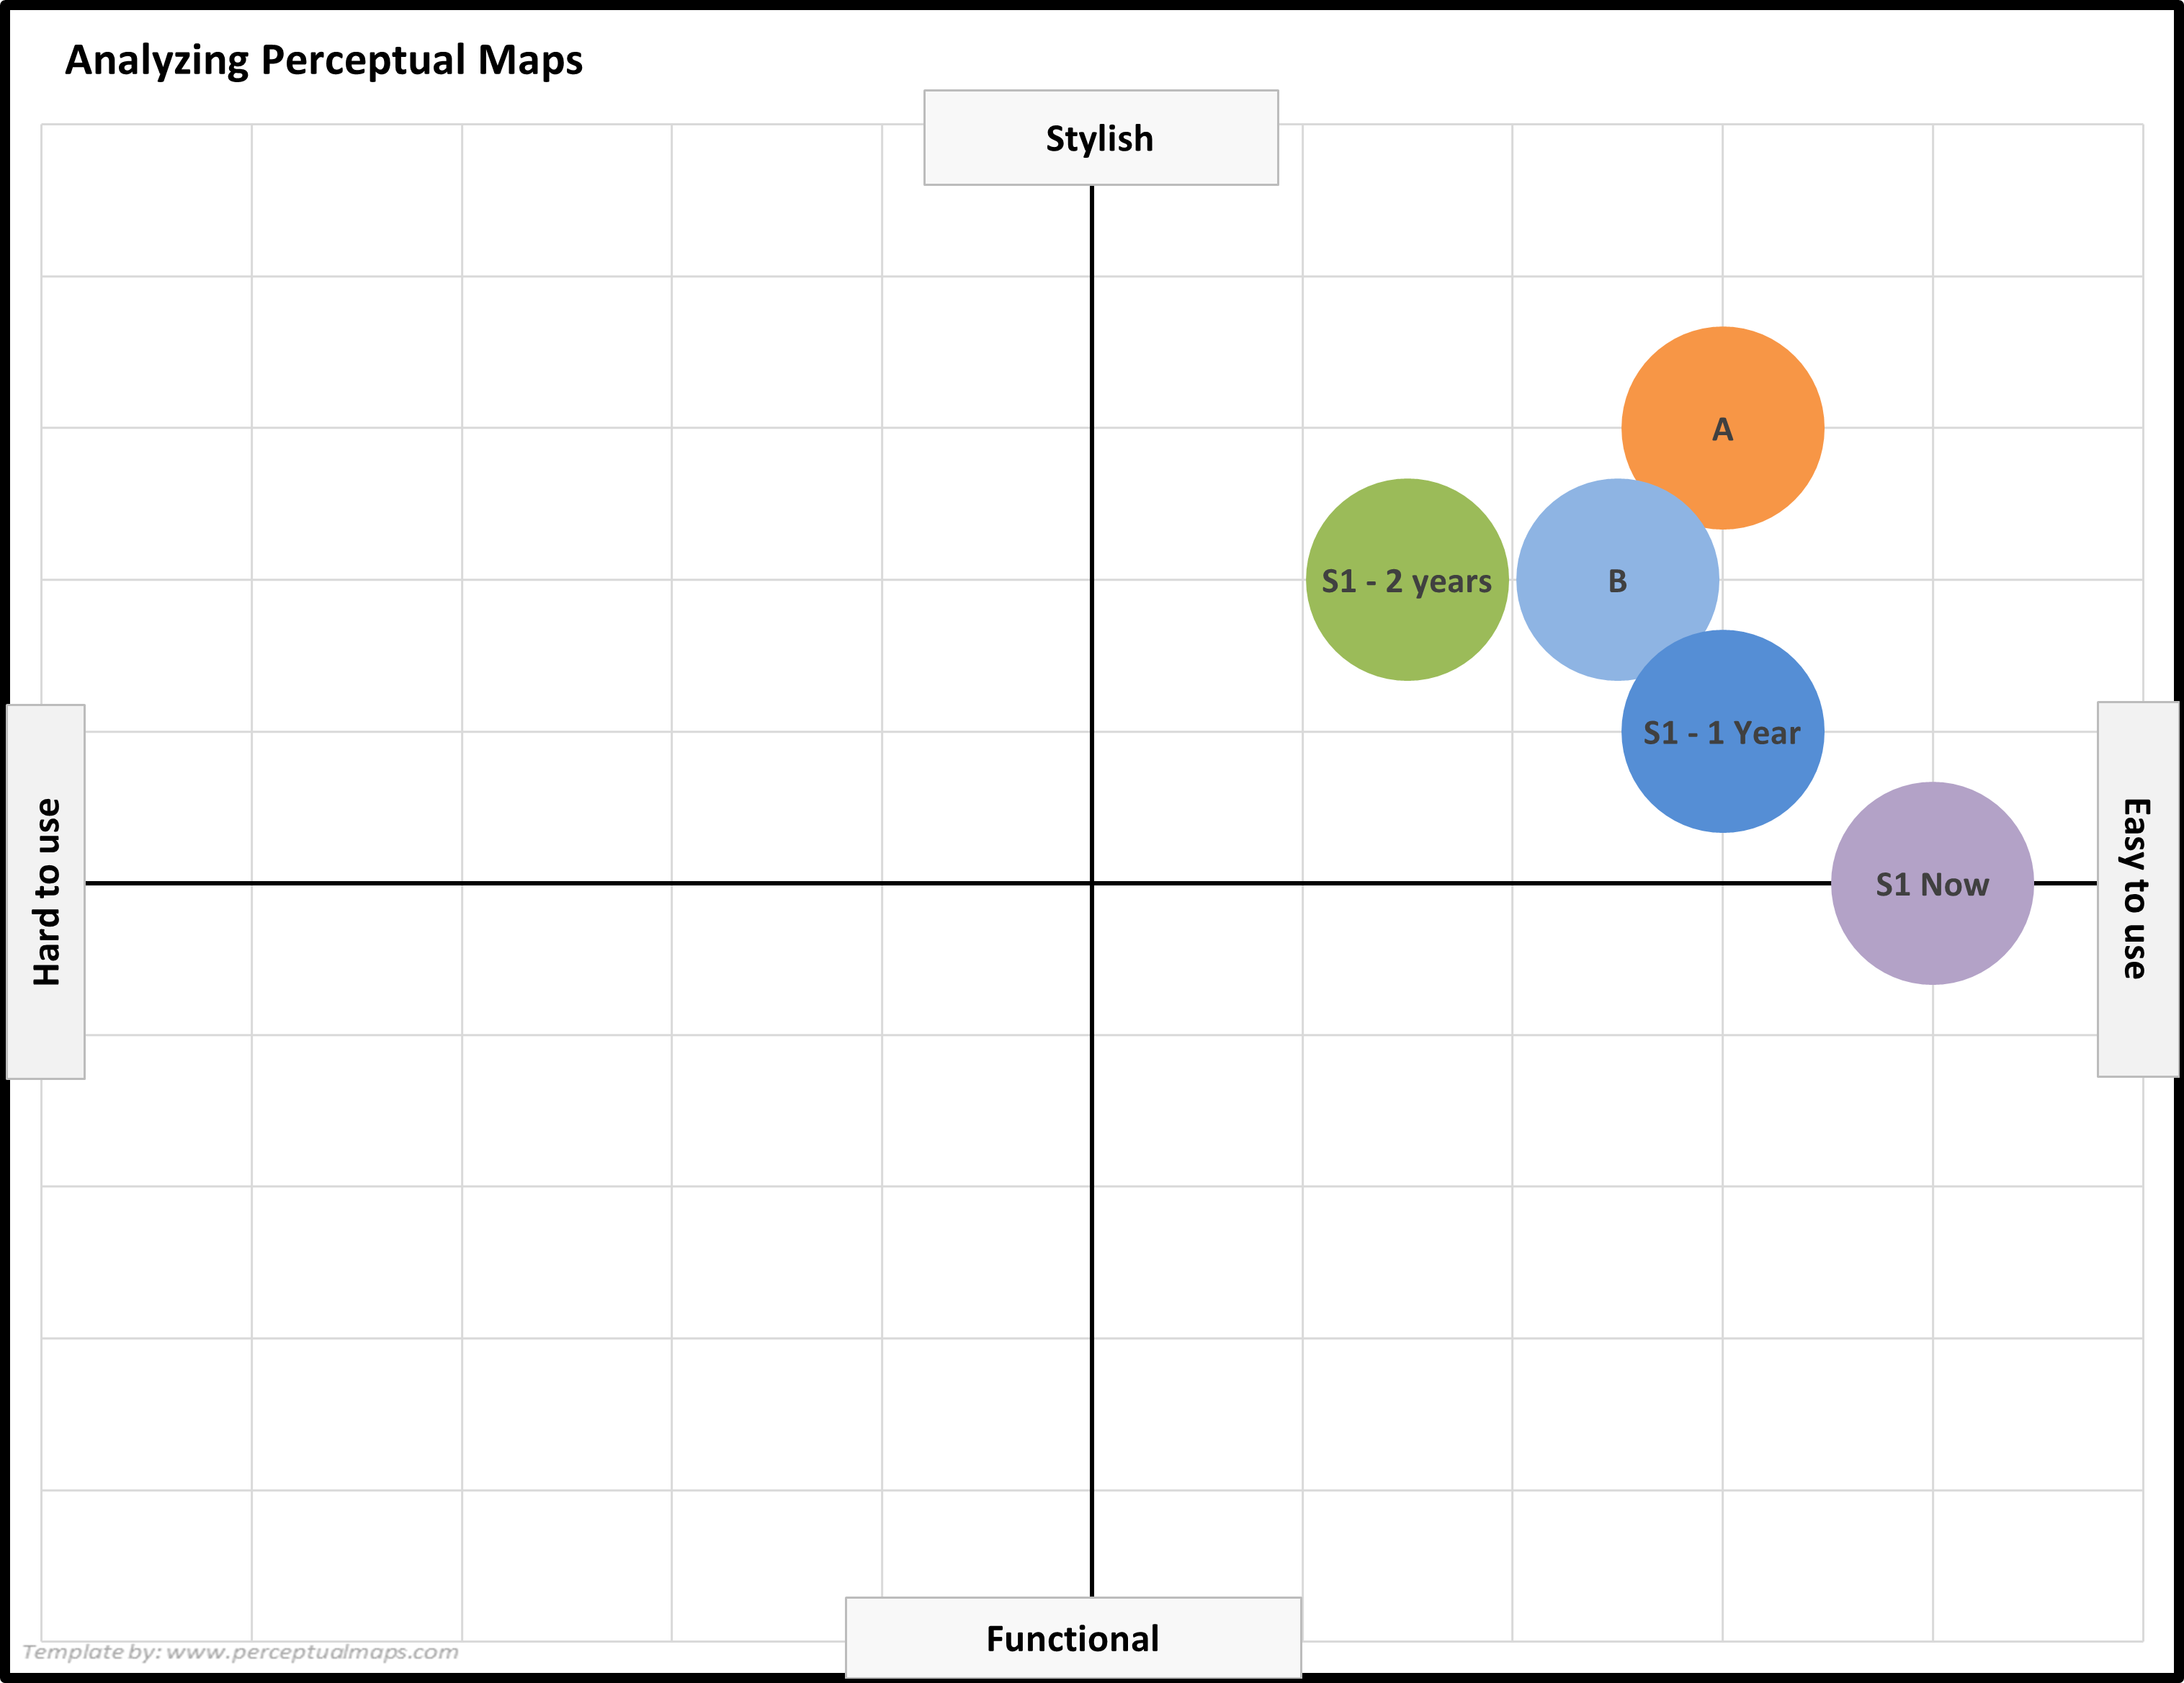
Let’s look at the following map where the changes in target market preferences also demonstrated. In this case, I have mapped Segment 1 today, back one year, and back two years – showing the consumers ideal preference of these two product attributes.
As we can see there is a substantial shift in the ideal product for these consumers (in this segment). If we can compare this to the above repositioning that – we can see that two years ago Brand B was ideally positioned next to the needs of Segment 1.
This helps explain why Brand A aggressively/deliberately repositioned their brand towards Brand B.
However, and unfortunately for both brands, they have been caught somewhat unawares that the preference for style/easy to use attributes for Segment 1 has shifted downward – away from style and more towards easy to use.
But as the common theme running through this analysis post – without mapping time of both brand position and segment preferences – we are somewhat running blind in terms of our positioning strategy and positioning success.
Question 5 = Are We Effectively Implementing Our Positioning Strategy?
Another key part of perceptual map analysis is to identify how we are tracking against our positioning/repositioning plan. Most brands will have the goal of either maintaining their current positioning, slightly repositioning or modifying their brand, or substantially repositioning their brand.
Generally these goals are aligned to key target markets and are based on selective attributes, product features, and benefits.
And given that positioning effectively sits in the minds of the consumer – and is based upon the full marketing mix offering – there is a substantial investment in positioning, which means that (as marketers) we need to examine and justify that our marketing efforts are successful in terms of our positioning strategy.
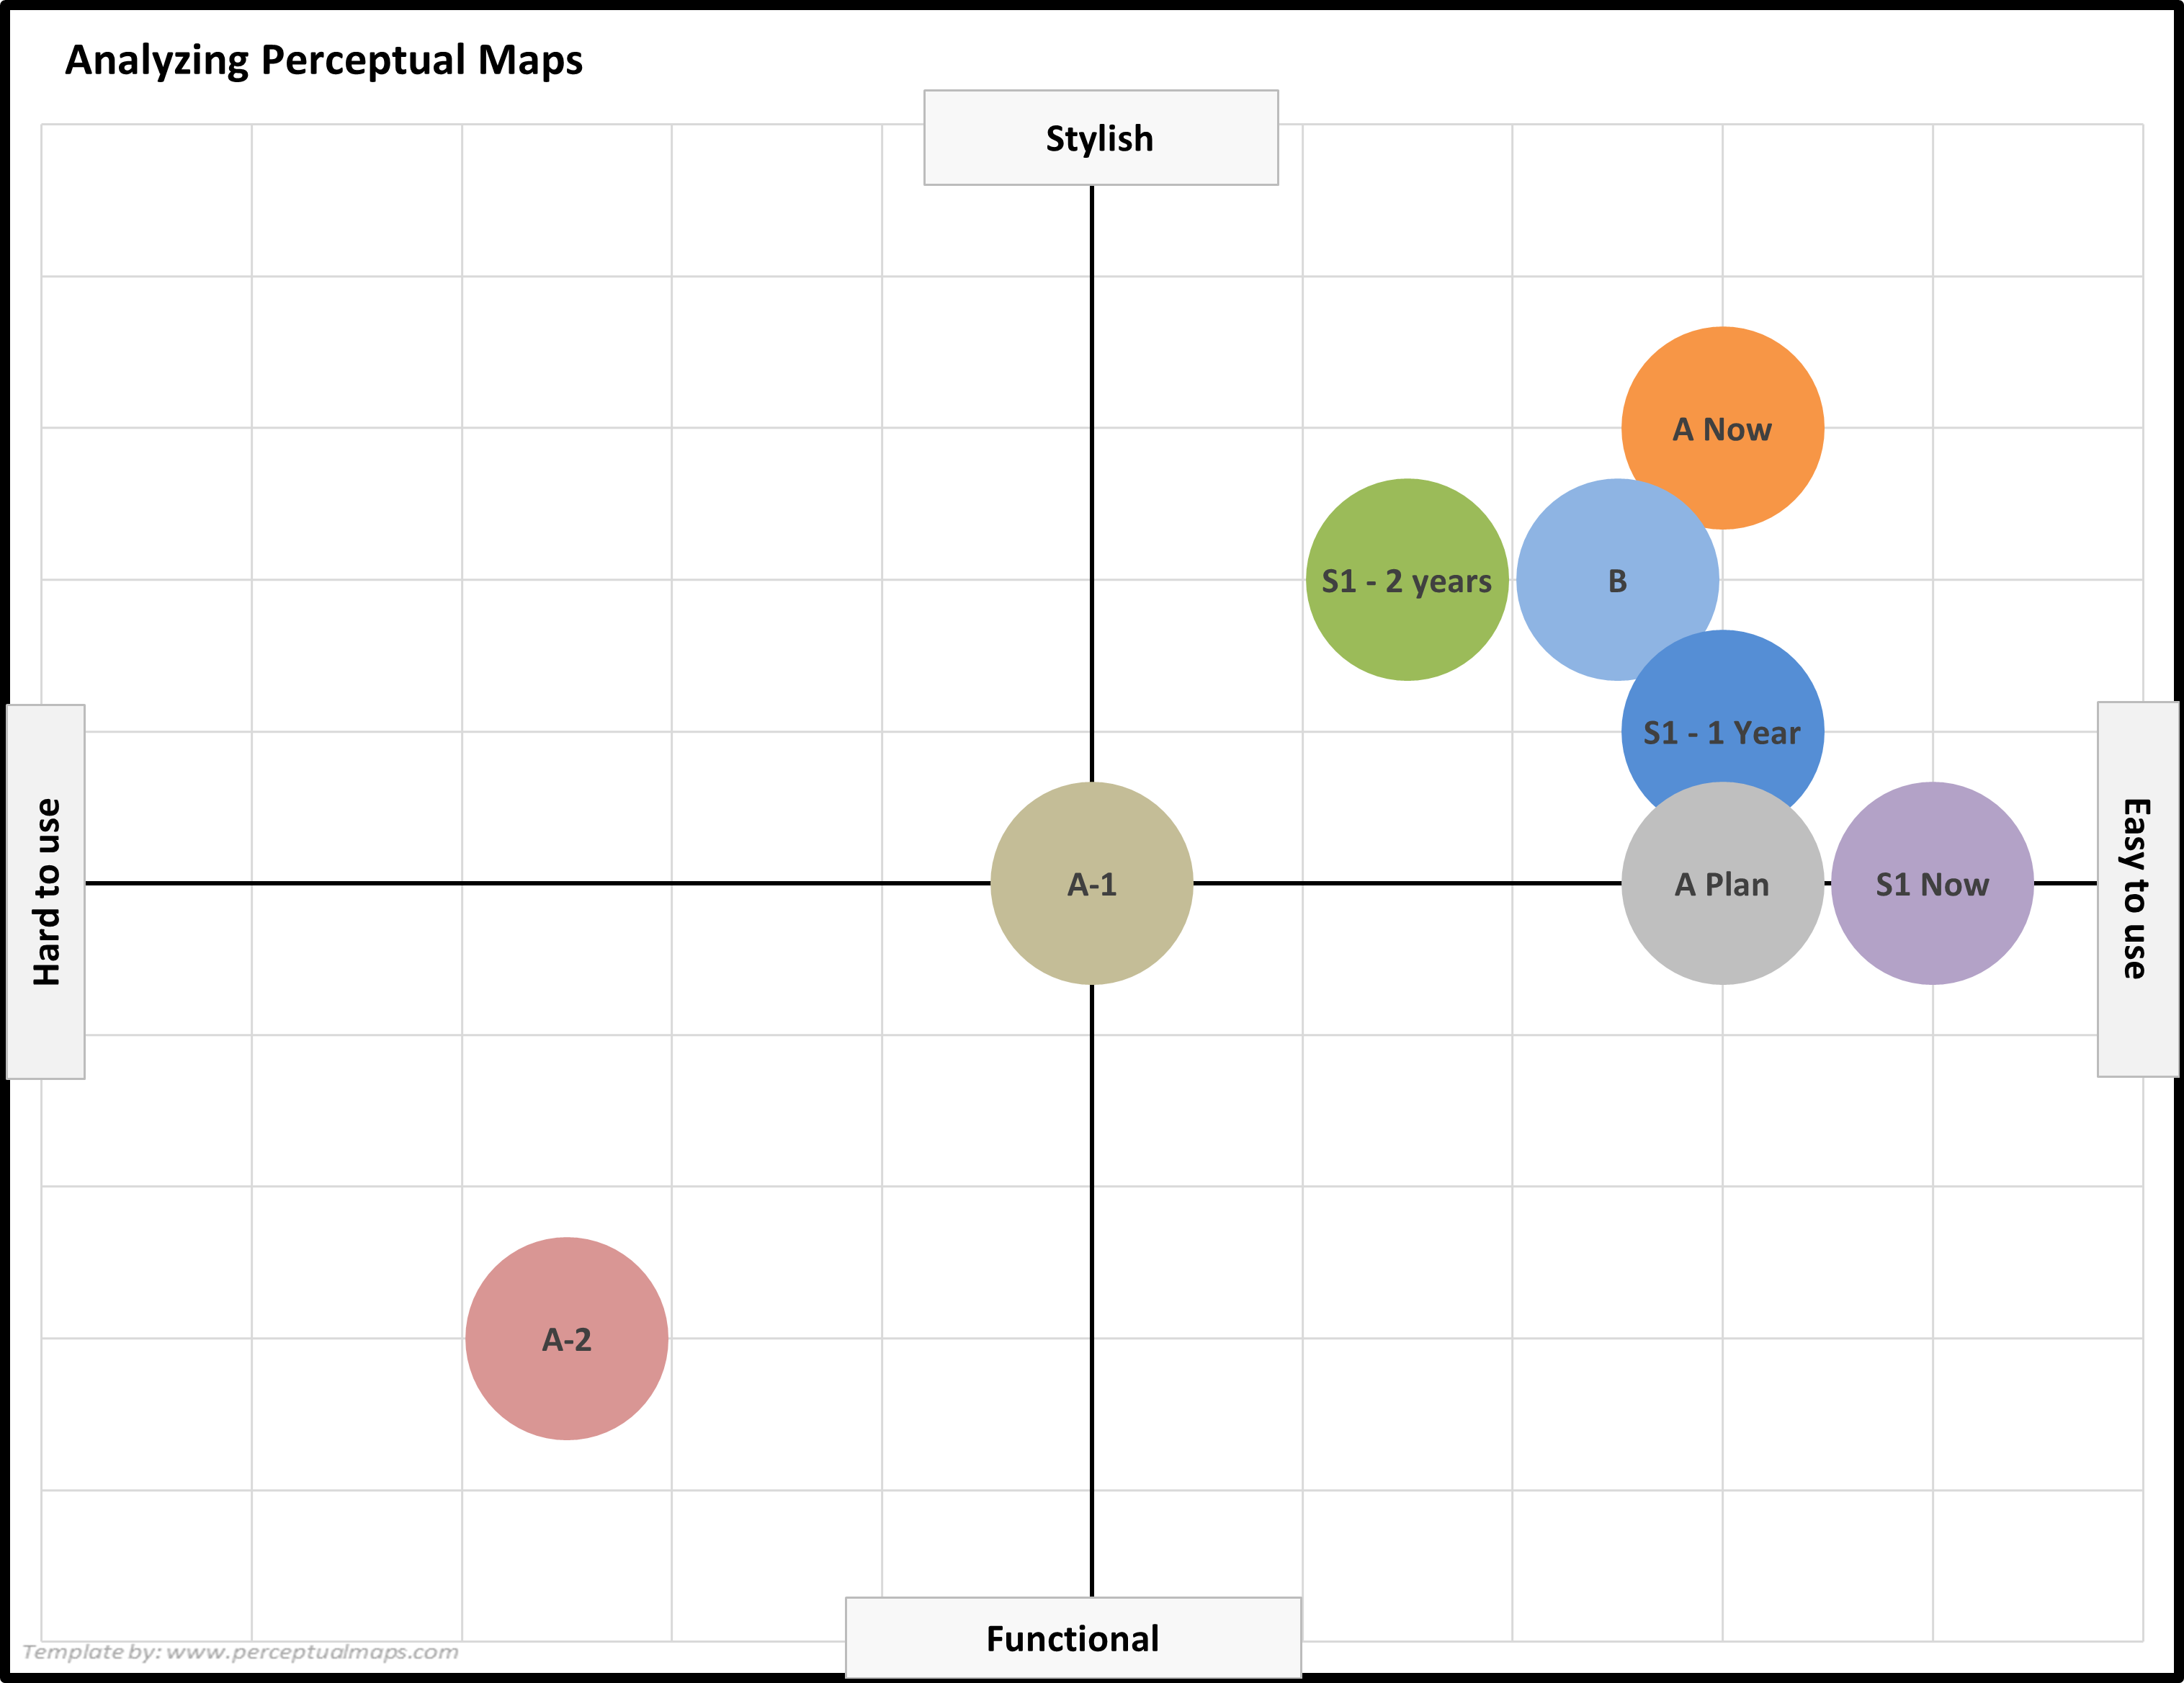
In the following example perceptual map, I have included:
- Brand A’s current position, and prior position for the last two years
- Brand B’s current position
- Segment 1’s current position, and prior position for the last two years
- And Brand A’s planned brand position
In other words, I’ve used a combination of the above perceptual maps and added where Brand A wanted to be positioned – as part of their brand repositioning strategy.
As we can see, their plan was to position much closer to “easy to use” and to be very aligned to the needs of Segment 1 – their strategy positioning plan (when we see it like this) – looks very sensible and logical.
But… for some reason, their desired positioning was not effectively executed – and they ended up being positioned (in the perception of consumers) away from their ideal positioning.
Again, by adding additional information to the perceptual map, we are consistently gaining more information and have a greater understanding of the marketplace. If we relied upon current brand positioning only and did not overlay time-based information or segment information – then we would have a very limited understanding of what was really going on in this marketplace.
Question 6 = How Do Our Marketing Decisions Impact Our Brand Positioning and Performance?
Now we have a good understanding of our brand’s perceived position in the market, relative to competition, consumer preferences, and historical image positions – we can then move to a deeper level of analysis by examining these changes against our and our competitor’s marketing mix decision-making.
Here are some of the questions we should seek to answer:
- How is our perceived positioning impacted by our marketing mix changes?
- How is our perceived positioning impacted by competitive marketing mix changes?
- Which elements of the marketing mix are mainly driving consumers perceptions?
- How is our perceived positioning and our sales and market share interrelated?
As we know, positioning is a combination of all our marketing mix elements, not just promotion or communication. So if we can work out the answer to some of these questions, we can construct some sort of crude marketing model, such as:
- “If we did this in terms of our marketing mix changes, then that’s going to change our positioning, and that will then deliver X dollars in revenue.”
Question 7 = How Do Individual Market Segments Perceive Our Brand?
As we know marketing, consumers have different needs, preferences, and market understandings. That’s why we construct market segments and then select target markets.
So rather than mapping the perceptions of the “average consumer” (or average market segment), we also need to map how each market segment views the brands.
Why would this be different? Different segments will have different perceptions of brands because they have different needs, they have different levels of brand awareness and understanding, they buy different brands on a regular basis, they shop in different stores, and so on – a whole bunch of reasons.
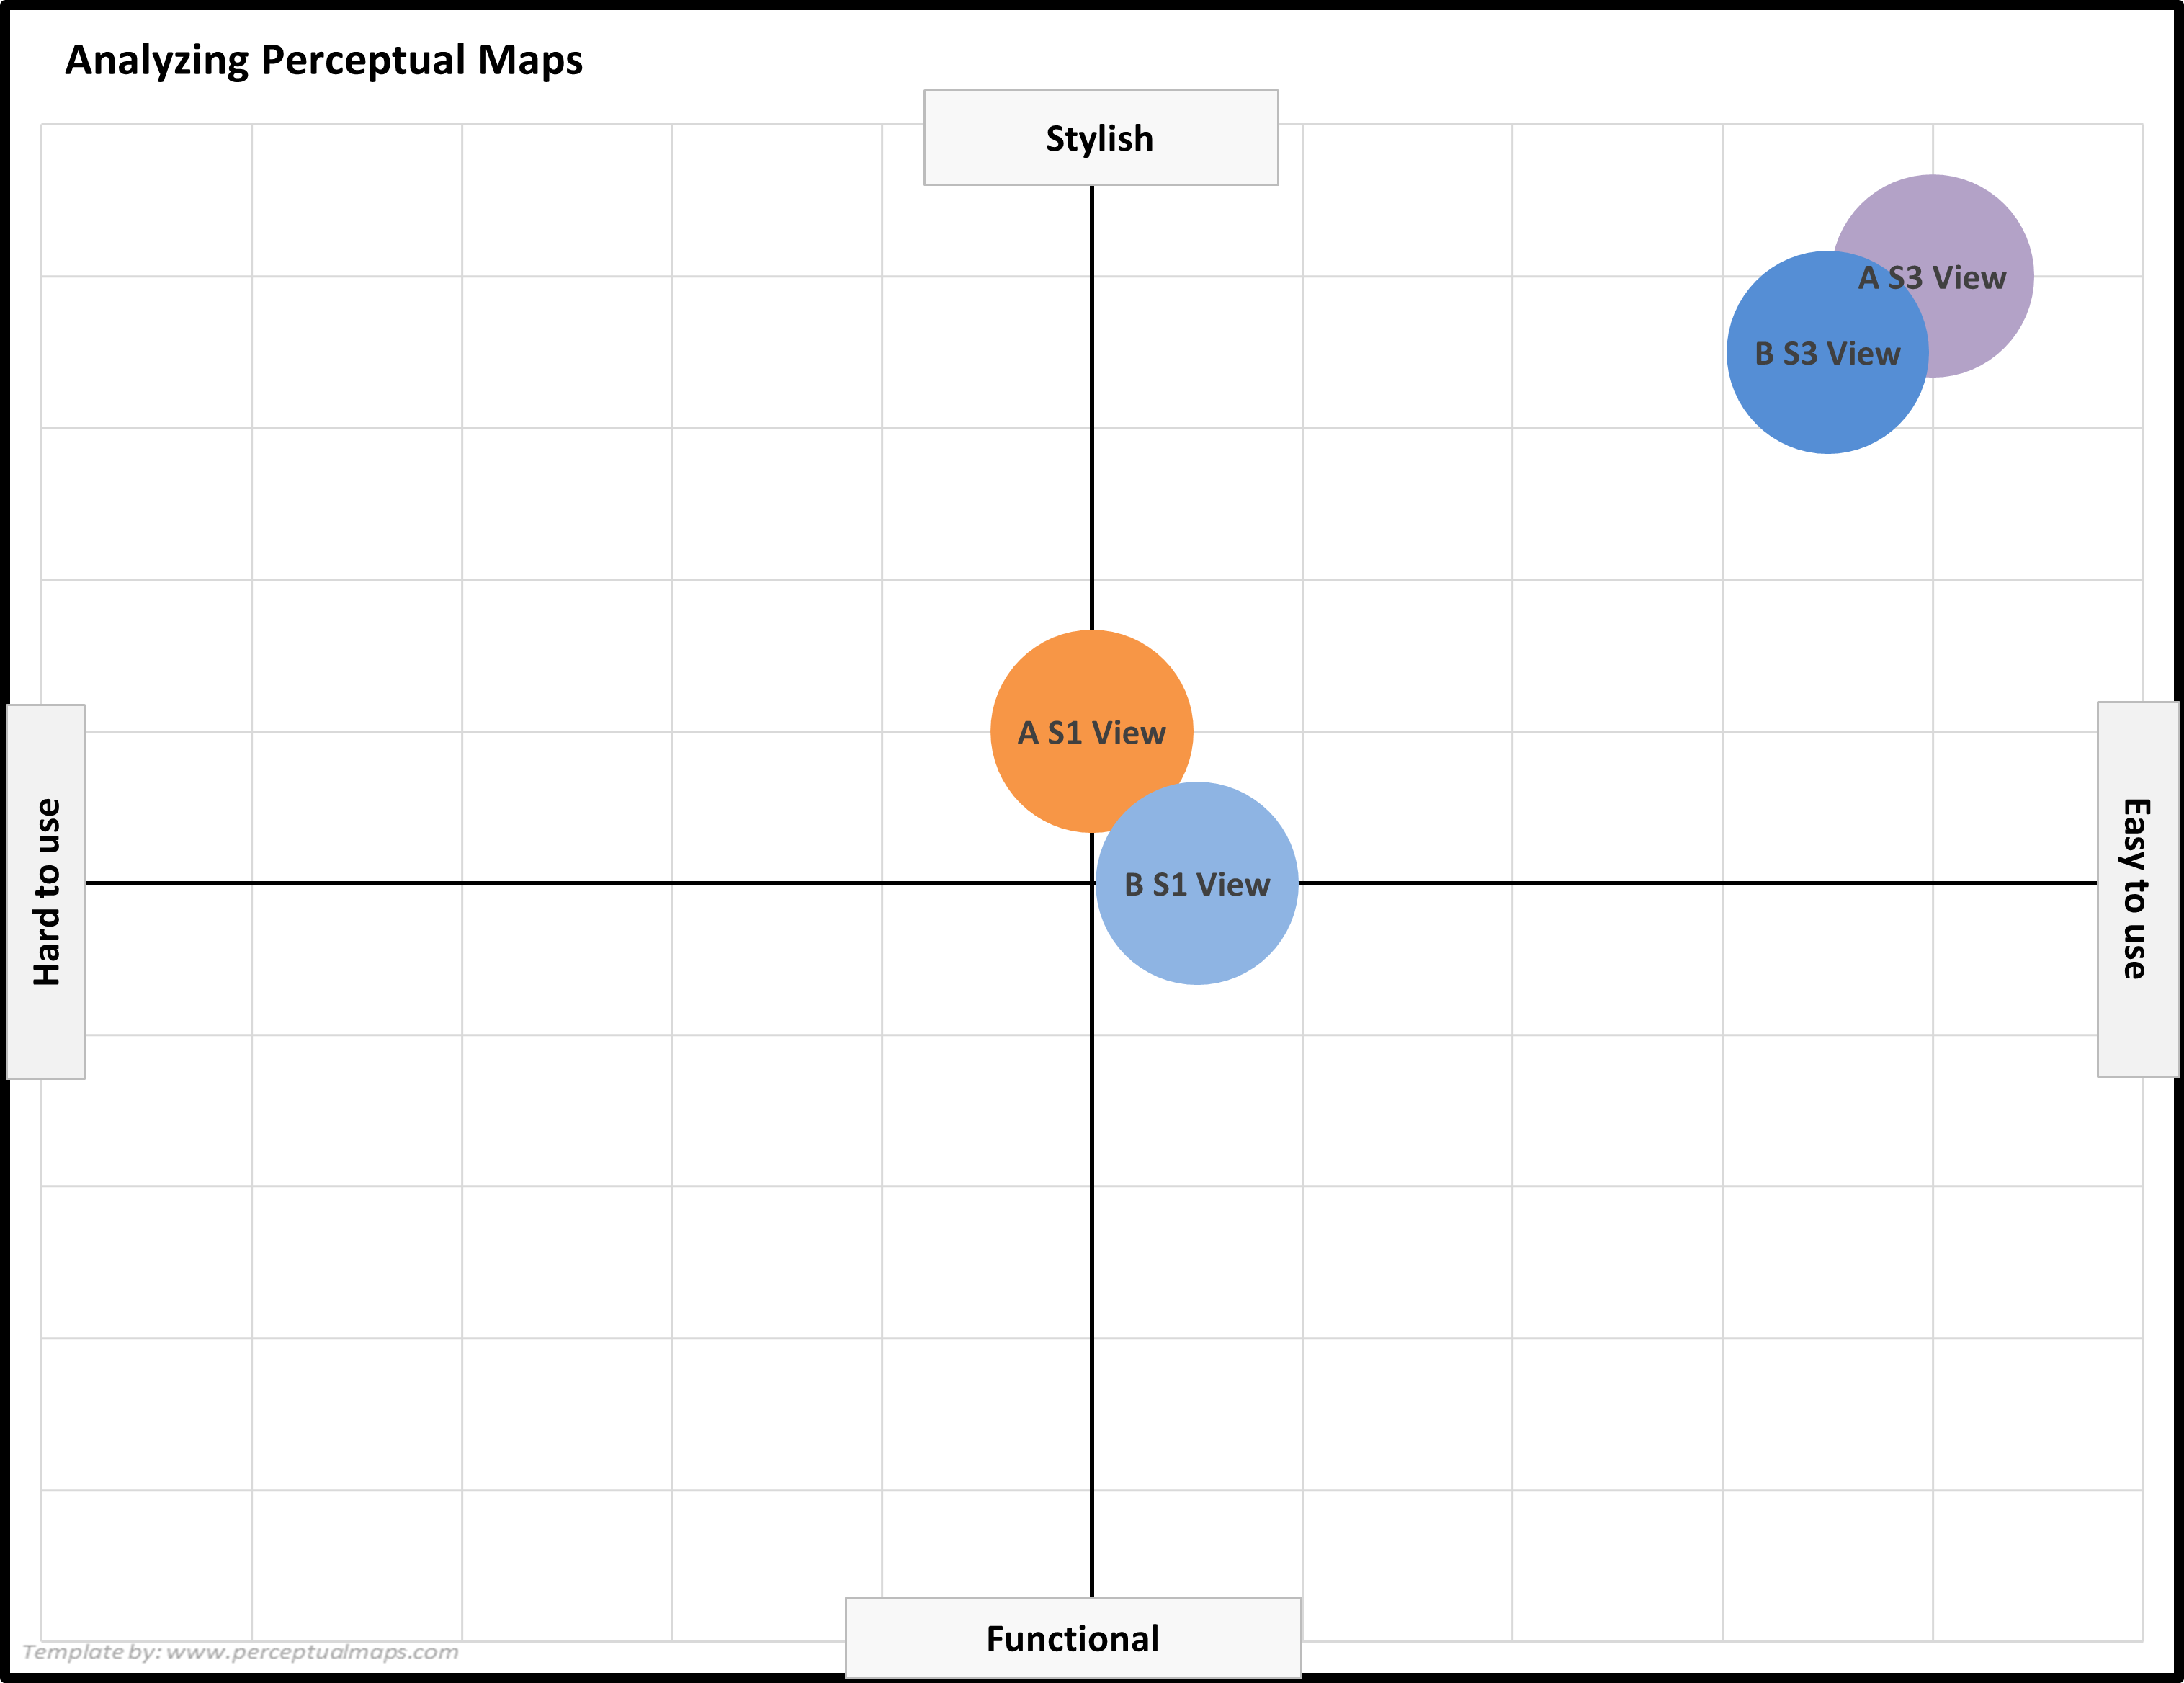
As we can see from the following example perceptual map – where I have included the brand positioning of Brands A and B from the viewpoint of Segment 1 and 3.
Because Segment 1 and 3 have different ideal preferences – they perceive the sets of brands as being quite different. Segment 1 who have a preference for a higher level of the easy to use attribute, perceived both brands as relatively average in this regard.
However, Segment 3 (with a much lower preference for easy to use) perceives both of these brands as being quite superior for this attribute.
Again, this additional information changes our assessment of how well the brands are positioned. As you can see, each layer of information or different construction of the perceptual map is generating new market insights. Again, I stress that is important to get beyond a basic two attribute only assessment when analyzing perceptual maps.
Question 8 = What Other Perceptual Mapping Tools are Available?
In addition to the standard two axis perceptual map that I have used above, we can also look at multidimensional scaling – which is a form of perceptual mapping that places all brands and attributes onto the same map at the same time, to give you an overall assessment and picture of the marketplace.
You can find more about multi-dimensional scale perceptual mapping here: What is a Multi-Dimensional Scaling (MDS) Perceptual Map?
The Wrap-up
Hopefully this article helps you with your analytics and insights when working with perceptual maps.
By utilizing multiple maps, taking into account time, segments, and competitor positioning, can provide valuable information for your marketing efforts.
By combining perceptual maps with other marketing metrics and goals, you can create a more comprehensive understanding of your brand’s place in the marketplace and adjust your strategies accordingly.
More Perceptual Mapping Information and Resources
Reasons to Use Perceptual Mapping
List of Product and Brand Attributes Ideas
Working with Perceptual Maps
- Perceptual Maps: Best Practice
- Get the Most Out of Your Perceptual Maps
- Top 12 Tips for Analyzing Perceptual Maps
Other Perceptual Mapping Tools
- Make 100s of Perceptual Maps Really Fast
- When to Use an Overall Similarities (OS) Perceptual Map
- What are Joint Space Maps?
- What is a Multi-Dimensional Scaling (MDS) Perceptual Map?
- How to Make a Perceptual Map in Excel 365
- How to make a perceptual map in PowerPoint
- Different Types of Perceptual Maps