Joint Space Perceptual Maps in Marketing
In this article, I’m going to cover joint space perceptual maps and why they’re so powerful, and why you should be using them with your marketing analysis.
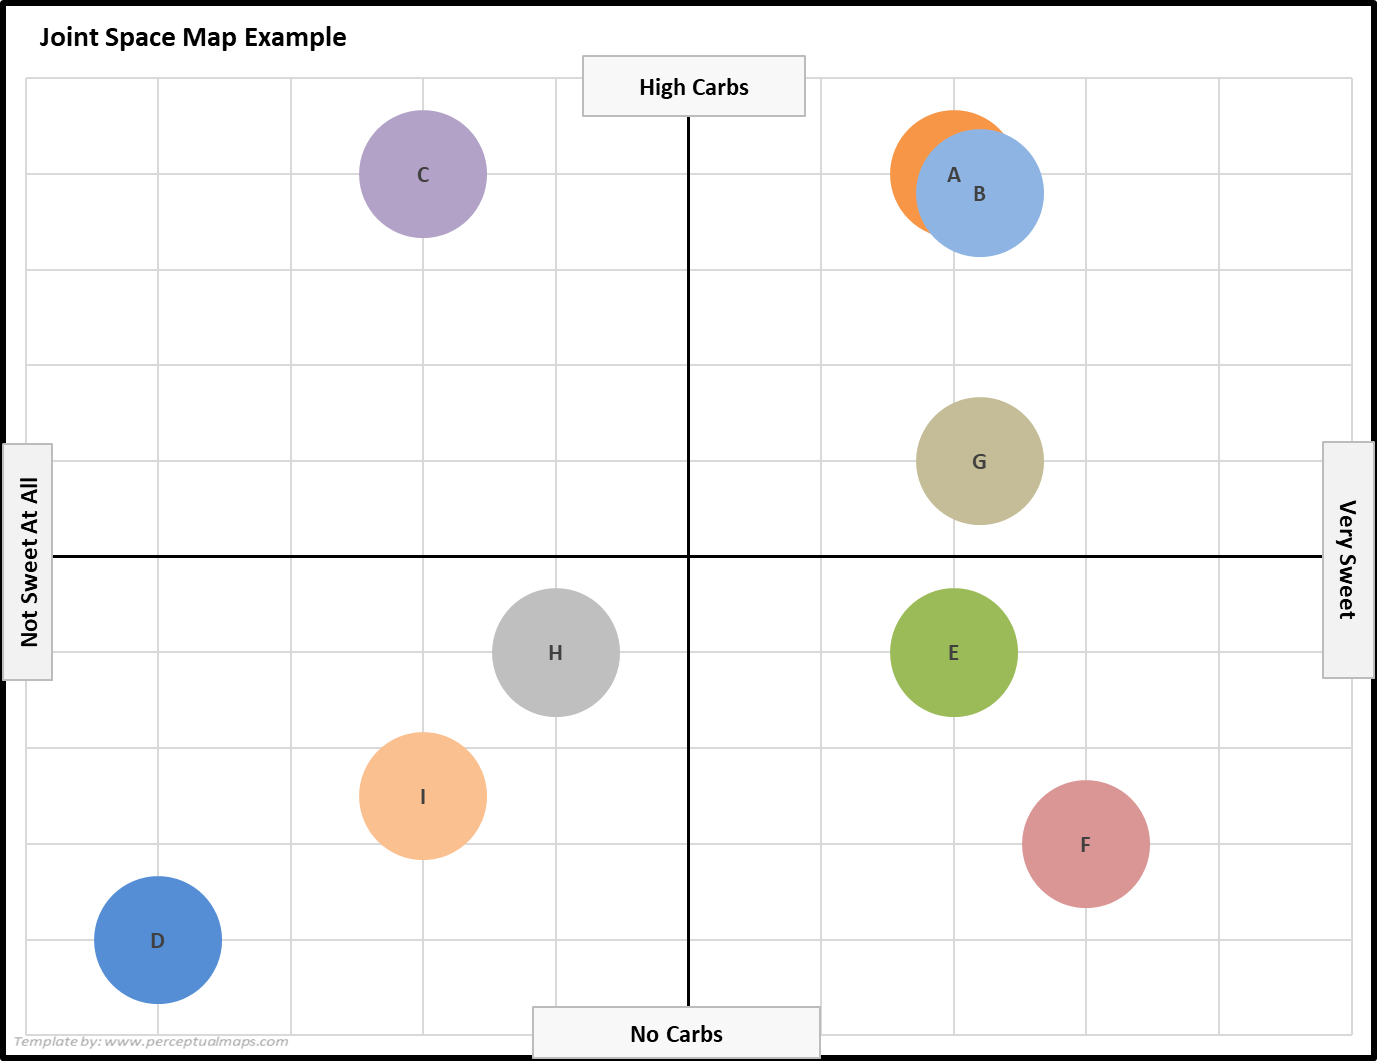
To better understand what joint space maps are, let’s quickly cover off the “normal” perceptual map. Below is an example of the standard two-dimensional (or two-attribute) perceptual map that is presented in most marketing textbooks.
This one has been constructed for a snack food market and I will be adding to it below to demonstrate what a joint space perceptual map is and why it is a powerful addition to your mapping toolbox.
As you can see, two product attributes have been used to build the perceptual map:
- on the horizontal axis = from very sweet to not sweet at all
- and on the vertical axis = from high in carbohydrates to no carbs at all
And also as you can see, there are 8 brand positions mapped as well – simply labeled by the letters A to I. And each of the brands have distinct positioning on the map – except for Brand A and B, who have quite similar (almost identical) positioning.
Quick clarification comment
I suppose your first question could be: why would we construct this map when we can tell that about the various brands in the market? We can measure or have a look at their ingredients and see where they fall in carbs, and we can also do some sort of taste or sugar analysis to work out how sweet they are or not sweet at all.
The reality is that we don’t care about reality; these are perceptions. We are mapping consumer perceptions and that’s why we’re using maps rather than some sort of technical analysis.
In marketing, we want to understand how the consumers think about the various brands:
- Which ones do they perceive to be high in carbs?
- Which ones do they perceive to be sweet?
Some of these brands, they may not buy regularly, so they may buy occasionally or never buy. Where they think these brands fall will determine their loyalty, their frequency of purchase, and whether they are consumers or non-consumers.
Please review the below video, or scroll down for the full article…
But where is the best position on the perceptual map?
The simple answer is we don’t know.
Unfortunately, for some reason, there’s always been this perception that the top right-hand corner here is the best positioning. That’s not true; that’s not correct. It depends on the attributes and it depends on the products that the brand makes that we’re looking at.
So the only way we can tell the best position is to also map consumer preferences. We also need ot ask:
- What is the ideal sweet range for you for a snack?
- What is the ideal amount of carbs?
This is where joint space perception maps comes in. Because we usually also need to compare the perceptions of brands to the ideal segment preferences.
And we can then add to our above map and create a joint space map by adding segment preferences for each of these product attributes. And that’s how we can answer how well these brands are positioned.
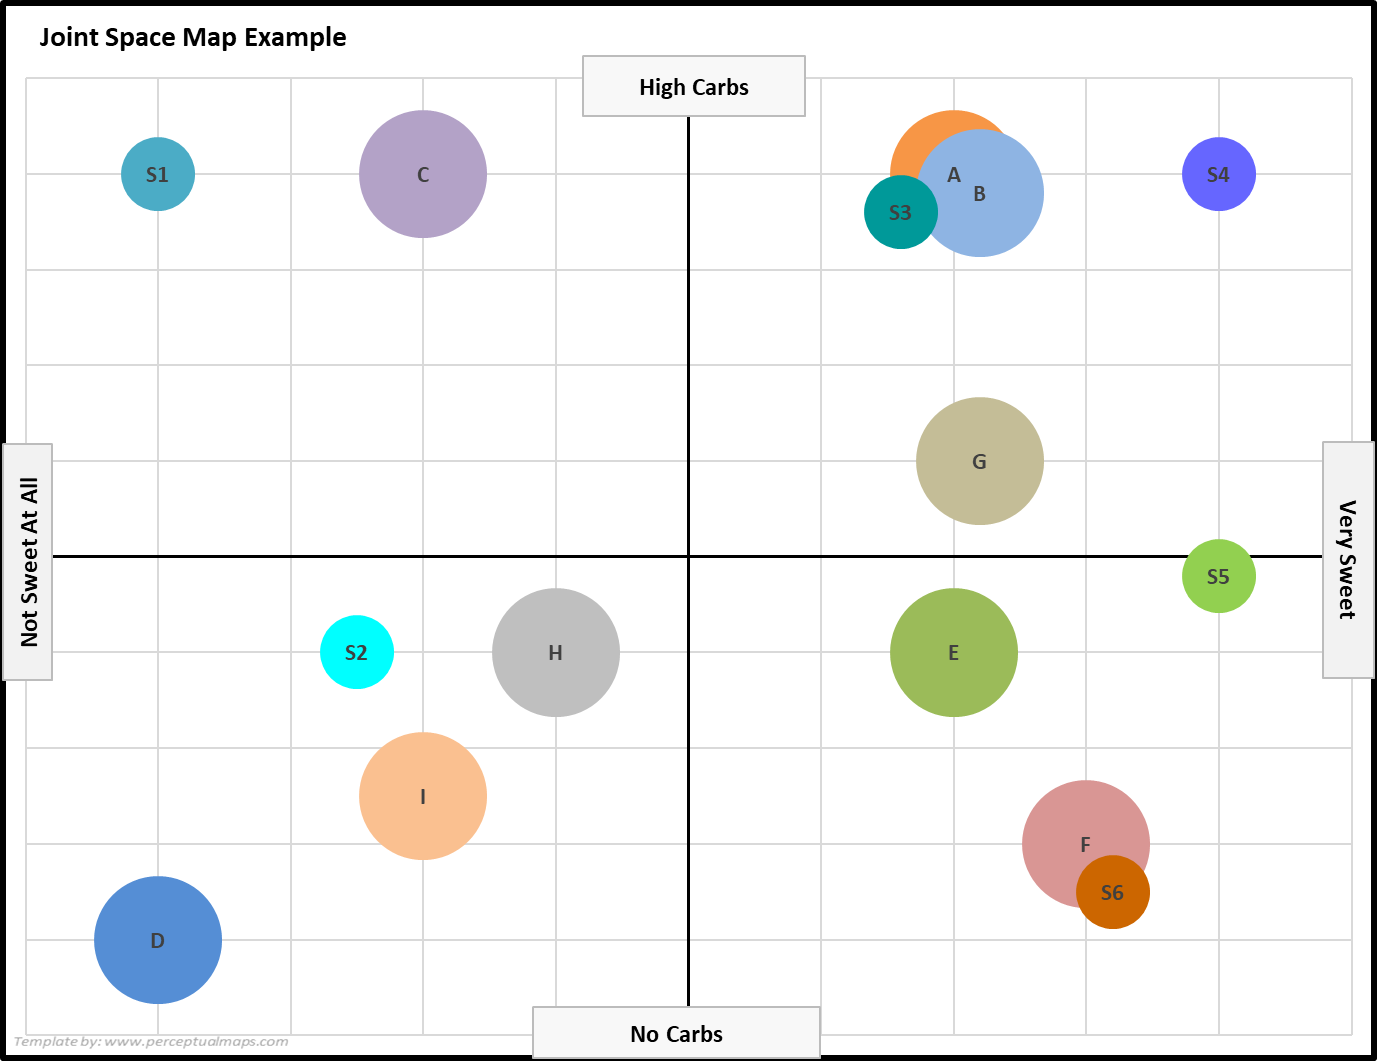
Let’s now look at the above map, but now with market segment preferences mapped as well. You should note that the brand positions are identical to the above map, but we have added the preferences of six segments (labeled S1 to S6).
Where is the best position on the joint space perceptual map?
Now we have BOTH brand positioning and ideal segment preferences, then we can answer this question. Let’s work through the map…
Let’s start with the two similar players, Brands A and B, which are up in the right top quadrant. It’s not great that they are so similar – BUT there are two target markets sitting up there as well. Which means that these brands are actually quite well positioned.
And even though the two of them are positioned side by side – and we always talk about wanting to be distinctive and having your own point of difference – they are gaining sales from two segments and probably sharing those sales relatively evenly – so all looking good for these two brands.
How about Brand C? On the first map we thought that C over was out of it and disconnected to the other brands in the market. But now we can see that they are targeting a different segment, and they are also well placed.
Brand D, however, is looking like they have poor positioning because their positioning is cluttered with other players and they are all competing for the same target market.
Of the three players – Brands D, H and I – Brand H seems to be quite close to the ideal preference of the segments, followed by Brand I. This makes both of these brands fairly well positioned. But Brand D is poorly positioned and needs to reposition itself.
Caveat Note
One thing I have not discussed is the size of these segments. For this example, I’m assuming they’re all the same size. Maybe if S2 was a large segment, Brand D’s positioning might be okay. But if it’s a average sized segment then D is not well placed.
Now turning to Brands E and G. They both appear to be targeting the same segment (S5). This is just okay, as we have two brands targeting one segment.
But it should be noted that both brands are some distance from the segment’s ideal attribute mix – so both brand could potentially improve their current positioning.
That leaves Brand F, which we can see is positioned very well – probably the BEST positioning in the market – as they are both quite distinctive/differentiated and very effectively targeting a precise segment.
Why You Need to Use Joint Space Perpetual Maps
Hopefully, as demonstrated above, without overlaying consumer preferences we simply don’t know what the ideal positioning is in the market. But once we add the segment preferences – then positioning strategy becomes very clear and obvious.
This is because our maps are no longer “average”. What I mean by this is we are using perceptual maps on a segmentation basis – not considering the average consumer.
If we just took the average of all these segments to find the ideal attribute mix, rather than six segments, we would find the average of these preferences is somewhere around the middle of the map.
This “average” preference would NOT align to any segment’s needs – and would be largely hypothetical. And suddenly (as compared to the above analysis) most brands have shifted from well to poorly positioned – which is NOT the case and not helpful for input into marketing decisions.
Related Articles and Information
- Joint Space Maps
- Perceptual Maps: Best Practice
- Top 12 Tips for Analyzing Perceptual Maps
- Get the Most Out of Your Perceptual Maps
- Free Download of the Perceptual Map Template
Joint Space Map FAQs
What is a joint space perceptual map?
A joint space perceptual map is a marketing tool that combines consumer perceptions of brands with their preferences for specific product attributes. It allows marketers to better understand the ideal positioning of a product or brand in a market and identify opportunities for differentiation.
How does a joint space perceptual map differ from a standard perceptual map?
A standard perceptual map only displays consumer perceptions of brands based on specific product attributes. In contrast, a joint space perceptual map also includes consumer preferences for these attributes, enabling marketers to identify the best positioning for their brands.
Why are joint space perceptual maps important in marketing?
Joint space perceptual maps are important because they help marketers understand both brand positioning and consumer preferences, allowing them to identify the best possible positioning for their products. This helps in targeting the right segments, differentiating products, and making better marketing decisions.
How do you create a joint space perceptual map?
To create a joint space perceptual map, first construct a standard perceptual map based on consumer perceptions of brands and specific product attributes. Then, gather data on consumer preferences for these attributes and add them to the map as segment preferences. This will allow you to analyze the relationship between brand positioning and consumer preferences.
How do you interpret a joint space perceptual map?
Interpreting a joint space perceptual map involves analyzing the positioning of brands relative to the ideal segment preferences.
Brands that are close to the preferences of a particular segment are considered well-positioned, while those further away may need to reposition or adjust their product attributes to better align with consumer preferences.
What is the significance of segment size in a joint space perceptual map?
Segment size is an important consideration when interpreting a joint space perceptual map. If a brand is targeting a large segment with its positioning, it may be well-placed even if there is competition from other brands.
However, if the targeted segment is small, a brand may need to reposition itself or target a different segment to maximize its market potential.