Contents
How to Create a Joint Space Map
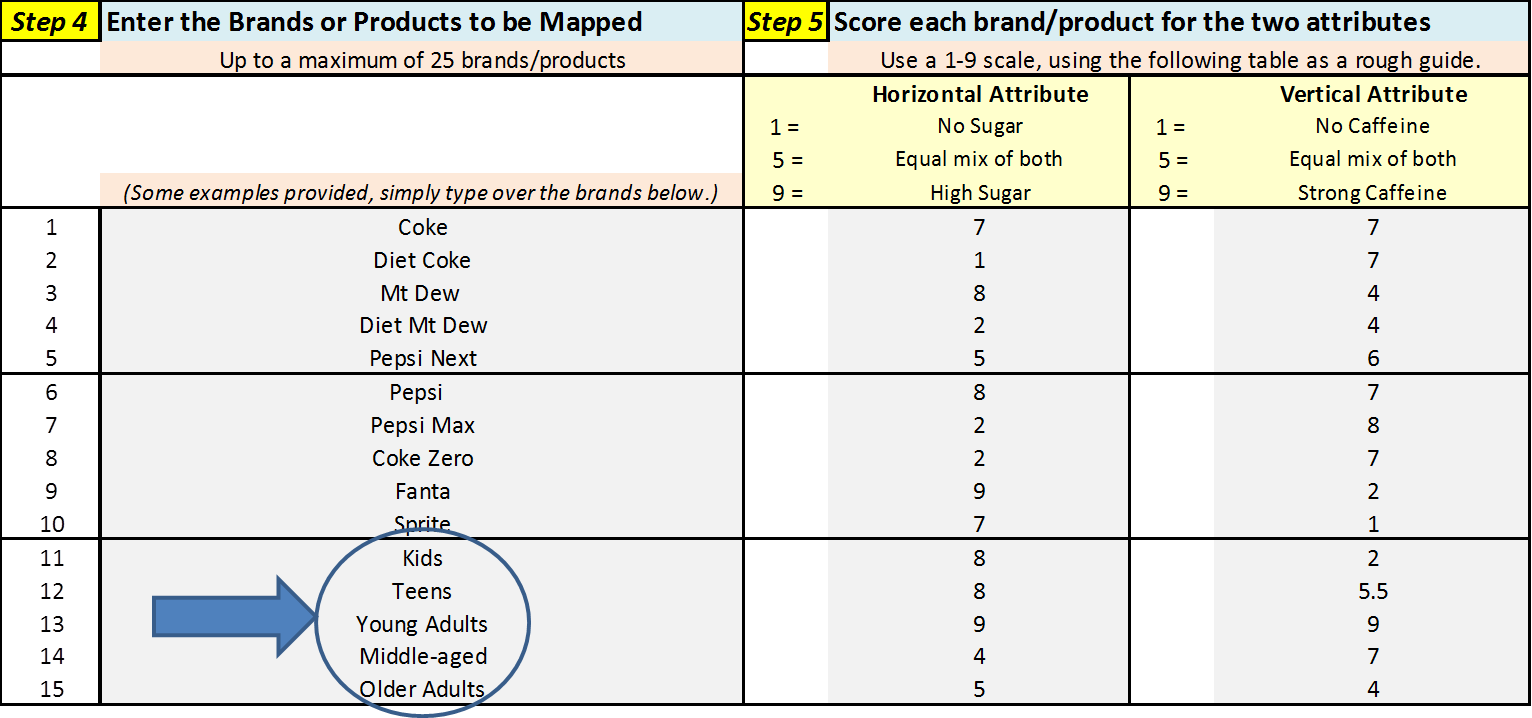
The above joint space map is very easy to construct using the free Excel template download available on this website.
Below is a section of that spreadsheet, and as you can see, to design a joint space map you simply enter the ideal positioning points for each of the market segments after you have entered the positioning points for each of the brands.
Want more information on Joint Space Maps?
- Please review the following video OR
- Please see: What are Joint Space Maps? OR
- Simply keep reading this article
We Add Consumer Preference Data to Create a Joint Space Map
Perceptual maps are commonly used to show how consumers perceive the positioning of brands in the marketplace, usually on the basis of two important and/or determinant attributes.
As the consumer data is usually obtained from an image survey, it is also possible to map the consumer’s ideal (or preferred) positioning of a product.
When BOTH perceived positioning of different brands and the preferred/ideal positioning is shown on the SAME map, then this is known as a Joint Space Map.
Joint space maps are very important when different market segments have quite distinct needs and, therefore, different target markets will choose between competing brands and products on a different basis.
Joint Space Maps Add Valuable Information
By integrating both the consumer’s perceptions of the various competing brands along with the preferred/ideal needs for the different consumer segments in the market, it makes a perceptual map far more powerful and more usable in marketing decisions.
People in marketing often like to use joint space maps because it is very important to understand the underlying needs and preferences of the different market segments. By plotting the segment’s preferred positioning, it becomes much easier to assess the effectiveness of a brand’s positioning.
This is because we have a clear goal of how to position our brand (or product) relative to the ideal needs of the target market, but also in reference to our key competitors.
Without knowing consumer preferences we are only “guessing” at how we think the product should be positioned – and perhaps surprisingly – consumers don’t always want the “best of the best” (that is, a product positioned in the top right hand corner of a perceptual map)!
Examples of Joint Space Maps
The following perceptual map is an example of a joint space map for the soft drink (soda) market, where different market segment preferences are listed as shown in the light blue circles. As you can see, BOTH consumer perception and ideal positioning points are jointly shown on the same perceptual map – hence the name of the map.
For this map, a simple age-based demographic segmentation base has been used to construct the market segments of: kids, teens, young adults, middle-aged people and older adults.
Two determinant attributes have been used to construct the map – namely no caffeine to strong caffeine (= the benefit of energy) and no sugar to high sugar (= the benefit of health or taste).

How to Read this Joint Space Map
The way to read this type of perceptual map is by considering that the strength of positioning of each of the brands now depends upon how well (that is, how close they are) to the various market segments preferred (or ideal) positioning points. For example, in the map Fanta is very well positioned for the Kids market segment.
To help understand how to read a joint space map, let’s look at some of the market segments. and brands shown…
Young Adults
The Young Adults market segment is the only segment that sits in the top right-hand corner – a position which is often mistakenly considered to be the best place on the map. Therefore, this target market prefers to drink that has both strong caffeine for energy and high sugar for energy and taste. As you can see, in this perceptual map example, Pepsi followed by Coca-Cola has the most suitable positioning for success with this market segment.
Teens
While Teens also have a fairly high preference for a sweet taste (by preferring a sugar-based drink), they have a preference for a mid-range caffeine product. As can be seen, this means that both Pepsi and Mountain Dew are well positioned in this regard.
Coca-Cola Brand
The traditional Coca-Cola brand has a more centralized position and is attempting to appeal to three different market segments with the same product – namely, Young Adults, Teens, and Middle-aged consumers. This is a common market targeting approach for strong brands, who try to have a appeal across the market segments. They are typically attacked by small competitors who target a specific market segment with a more precise product positioning.
Kids
As highlighted above, the Fanta brand is well-positioned for this segment, being perceived as having a sweet taste but with little/no caffeine. Their key competitor in this segment is Sprite, which is also perceived as having little/no caffeine but with a less sweet taste (that is, a less sugar content). Keep in mind that Sprite may have more/less sugar content than Fanta, that is not the point – what is important is how consumers perceive the product offerings.
Diet Coke
The opposite brand to Sprite and Fanta is Diet Coke, as it appears diagonally opposite on the perceptual map and a reasonable distance away. This means that Diet Coke not well suited to the Kids segment’s ideal preferences (as Diet Coke is perceived as being low in sugar taste and high in caffeine), which makes this brand is perceived as a poor fit to the needs (ideal positioning) of this target market.
Another Joint Space Perceptual Map Example
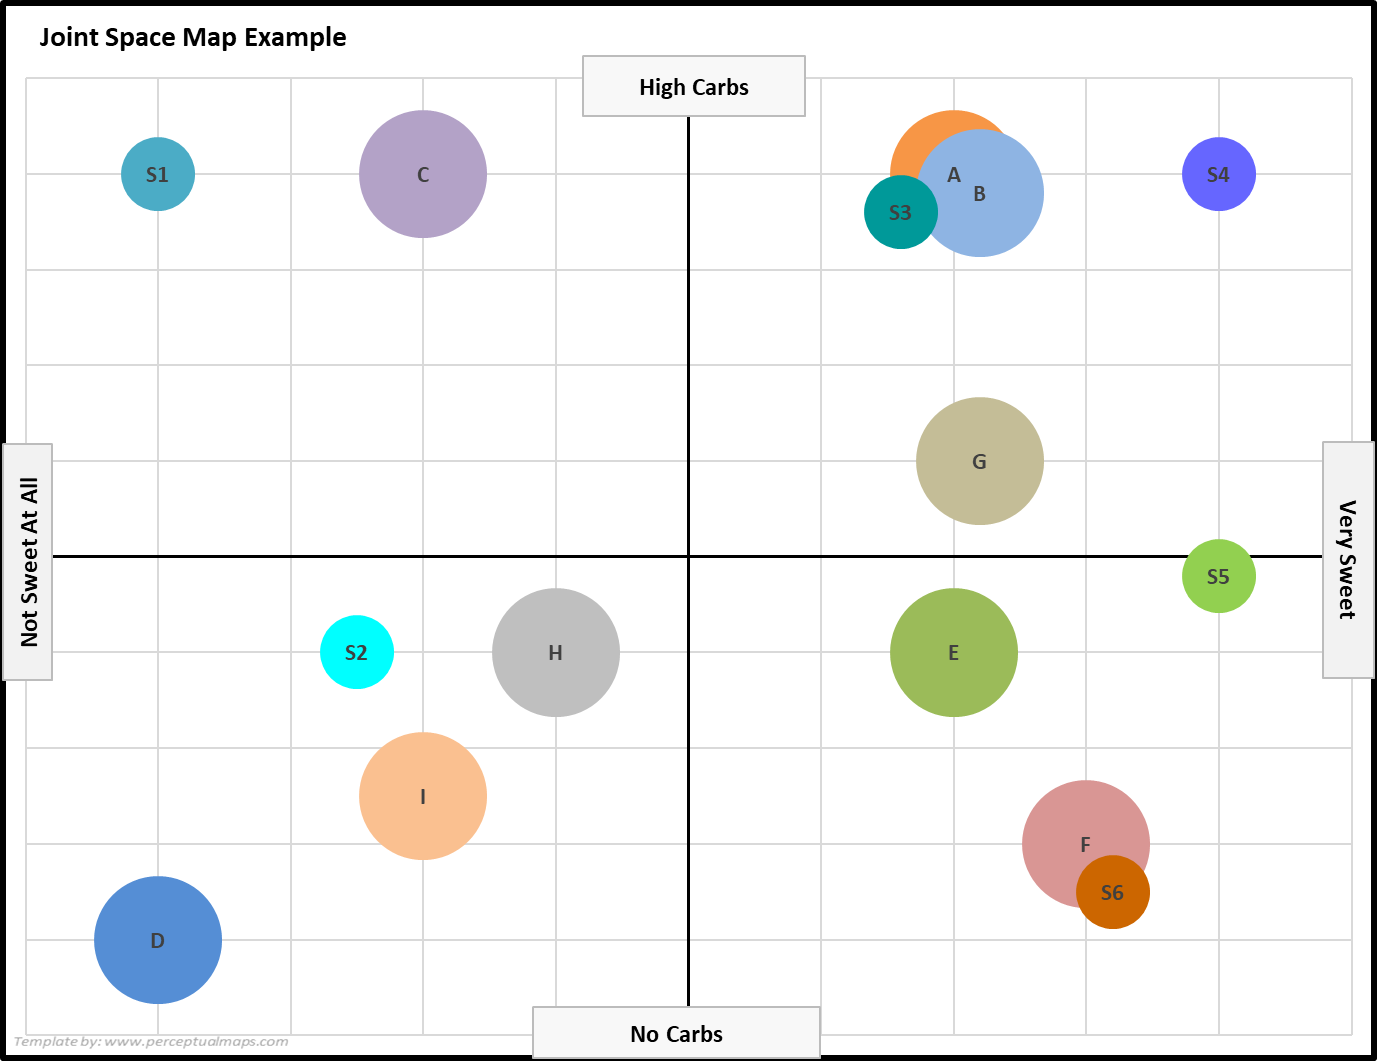
Here is another example of a joint space map. As you can see, we are mapping the brands (labeled with letters) AND we are also mapping the segment preferences (labeled S1 to S6) for each product attribute.
And when we combine both the brand positions AND the segment preferences, we can now clearly see which of these brands are well positioned, as well as identifying their positioning strategy and their target market/s.
Joint Space Maps: Quick FAQs
What is a joint space map?
A joint space map is a type of perceptual map that combines both the perceived positioning of different brands in the marketplace and the preferred or ideal positioning according to consumer preferences.
Why are joint space maps important?
Joint space maps are important because they provide valuable information by integrating consumer perceptions and preferences. They help marketers understand the needs and preferences of different market segments and assess the effectiveness of a brand’s positioning.
How are joint space maps created?
Joint space maps are created by combining data obtained from consumer surveys, which capture both the perceived positioning of brands and the preferred positioning of a product.
This data is then plotted on the same map to visualize the relationship between consumer perceptions and preferences.
Why is it important to consider consumer preferences in positioning a product?
Considering consumer preferences is crucial in positioning a product because consumers may not always want the “best of the best” as perceived by marketers. By understanding consumer preferences, marketers can position their product relative to the ideal needs of the target market and align their strategy accordingly.
Further information
- What are Joint Space Maps?
- Please see the how-to-format guides, plus the page of example perceptual maps.
- Perceptual Maps: Best Practice