Contents
- 1 Looking for Example Perceptual Maps?
- 1.1 Let’s Go… Here are Examples of Perceptual Maps
- 1.2 EXAMPLE: A Simple Perceptual Map for Home Entertainment (Streaming Services)
- 1.3
- 1.4 EXAMPLE: Another Perceptual Map for Streaming Services
- 1.5 EXAMPLE: And One More Perceptual Map for Streaming Services
- 1.6 EXAMPLE: Using Perceptual Maps to Show Positioning Changes = Repositioning
- 1.7 EXAMPLE: Using Perceptual Maps to Show Different Competitive Sets
- 1.8 EXAMPLE Perceptual Maps for the Fast Food Market
- 1.9 EXAMPLE Perceptual Maps for the Soda (Soft Drink) Market
- 1.10 EXAMPLE Perceptual Maps for Car Brands
- 1.11 EXAMPLE Perceptual Maps for Smart Phone (and Cell) Phones
- 1.12 EXAMPLE Using a Perceptual Map to Own Part of the Market
- 1.13 EXAMPLE Perceptual Map Highlighting Me-too Positioning
Looking for Example Perceptual Maps?
Well look no further – Perceptual Maps 4 Marketing has got you covered. Just scroll down to review a collection of example perceptual maps below.
Or if you are looking for maps for a particular market or industry then check out these maps and information, which will also provide you will attributes scores and their rationales:
- Example Perceptual Maps for Breakfast Cereals
- Example Perceptual Maps for Streaming Services
- Example Perceptual Maps for Restaurants
- Example Perceptual Maps for Smart Phones
- Example Perceptual Maps for Soda (Soft Drinks)
- Example Perceptual Maps for Candy Bars
- Example Perceptual Maps for Fast Food
- Example Perceptual Maps for a Coffee Shop
- Example Perceptual Maps for Retailers
Or if you want to quick make your own perceptual map – then go to the download page:
Let’s Go… Here are Examples of Perceptual Maps
Please note that all of the following perceptual maps were produced using the free software download available on this site.
You will see that there are different perceptual maps presented across the same market at times. This has been done deliberately to demonstrate how the positioning of firms and brands can be constructed using different product attributes on the perceptual map.
I would encourage you, where appropriate, to produce multiple perceptual maps and even present more than one in your marketing assignment. This is because multiple maps will allow you to look at the same market and competitive sets in different ways and should deliver greater insights. Please review: Perceptual Maps: Best Practice
Please keep in mind that we are mapping the perceptions of consumers (or a specific target market), not the actual reality of the market. As marketers, it is necessary for us to understand how consumers differentiate between brands in their minds.
EXAMPLE: A Simple Perceptual Map for Home Entertainment (Streaming Services)
As you can see, this perceptual map has two attributes – namely, wide choice to limited choice and high quality to mixed quality. Therefore, the physical construction of perceptual map should include: a clear heading of the chart describing the market, on a scatter-plot graph, with the two axis being important (determinate) attributes, as shown below.
Because we are after consumers perceptions of these brands, we typically obtain information from a consumer survey. In this case we would ask consumers to rank each of the entertainment brands on a scale, say 1 to 9, for each of these attributes.
We are likely to ask the consumer their opinion on multiple attributes, which allow us to create multiple perceptual maps. When constructing a perceptual map, ideally we are seeking “determinate” attributes. These are attributes that are quite important in the consumer’s decision-making process.
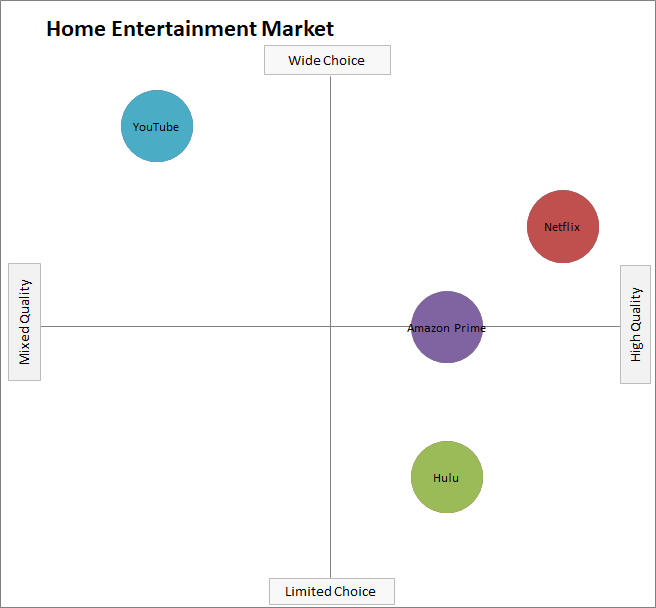
Note: This perceptual map was created using information derived from this comparison site.
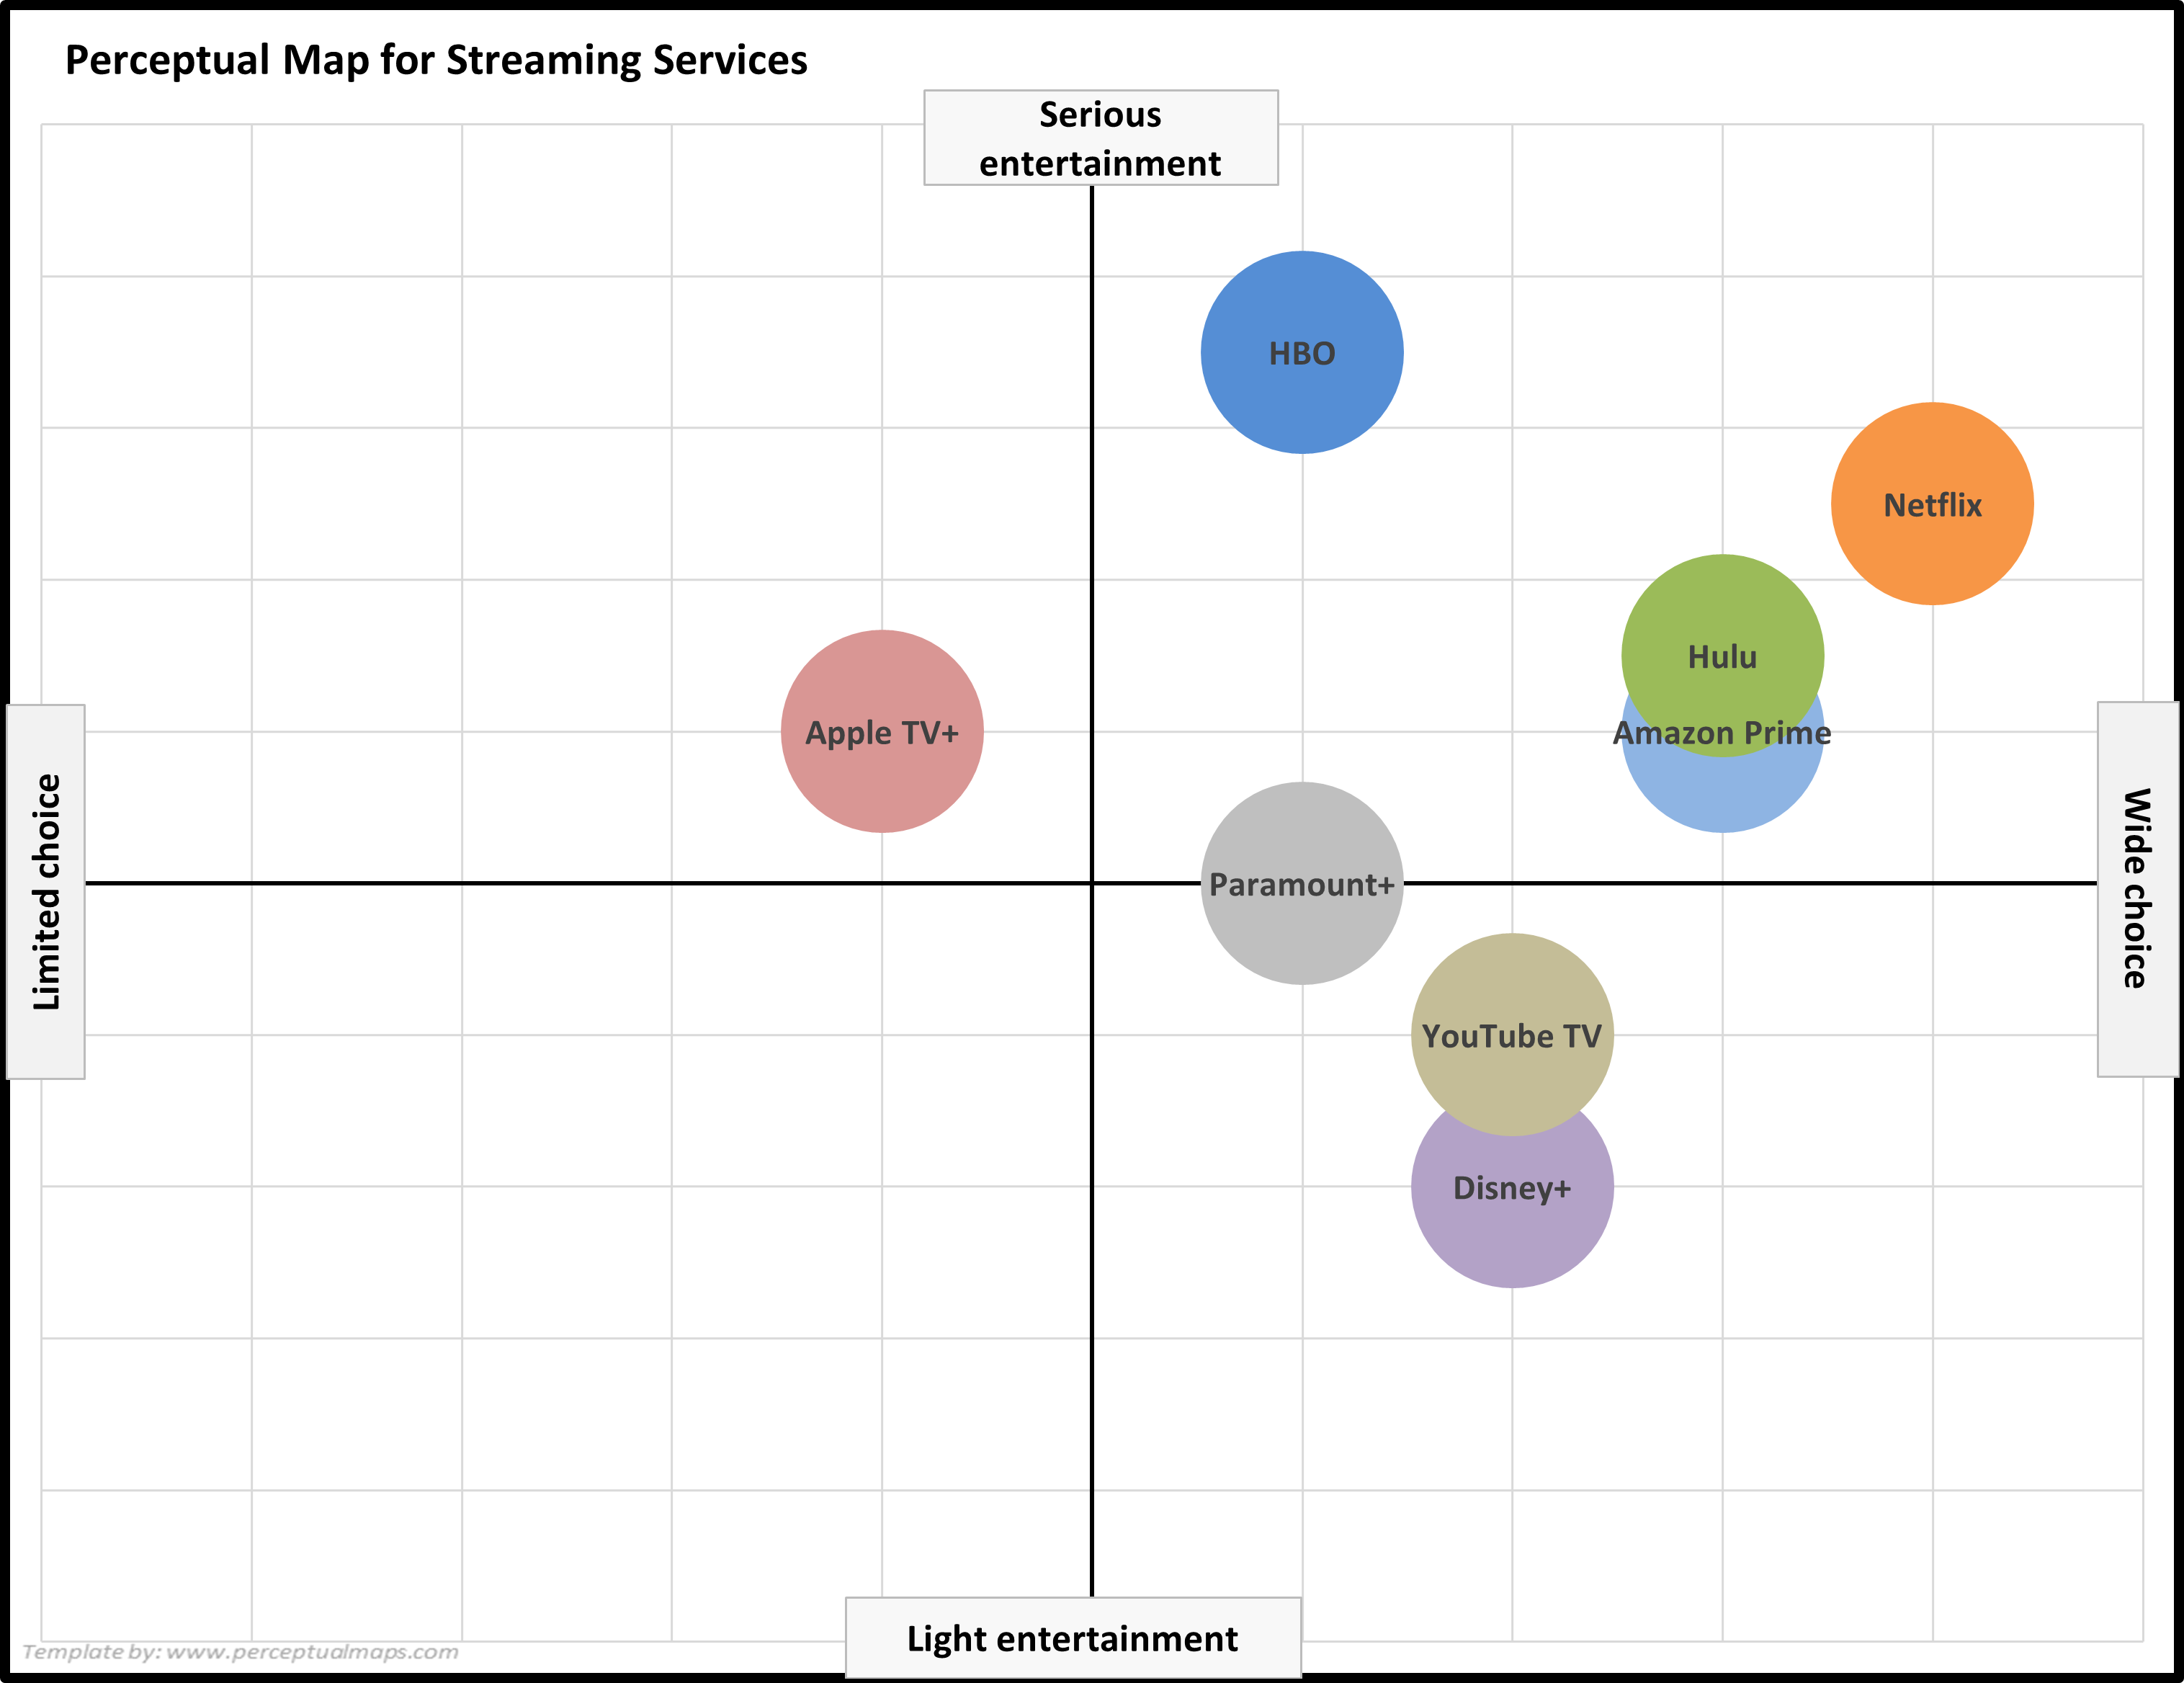
EXAMPLE: Another Perceptual Map for Streaming Services
Here is a perceptual map, still looking at home entertainment (streaming services), but this time with more brands (competitors added). For details on how this map was constructed, please see: Example Perceptual Maps for Streaming Services.
What you should note is that one of the attributes has changed – we have swapped out the quality attribute for ‘serious to light entertainment‘. And what happens? We have a new map and a new view of the market.
That’s why it is ALWAYS important to run multiple perceptual maps in you analysis – not just one or two!!! The more maps you run, the greater your knowledge of positioning = the greater your chance of discovering market insights.
Please review: Perceptual Maps: Best Practice and Make 100s of Perceptual Maps Really Fast
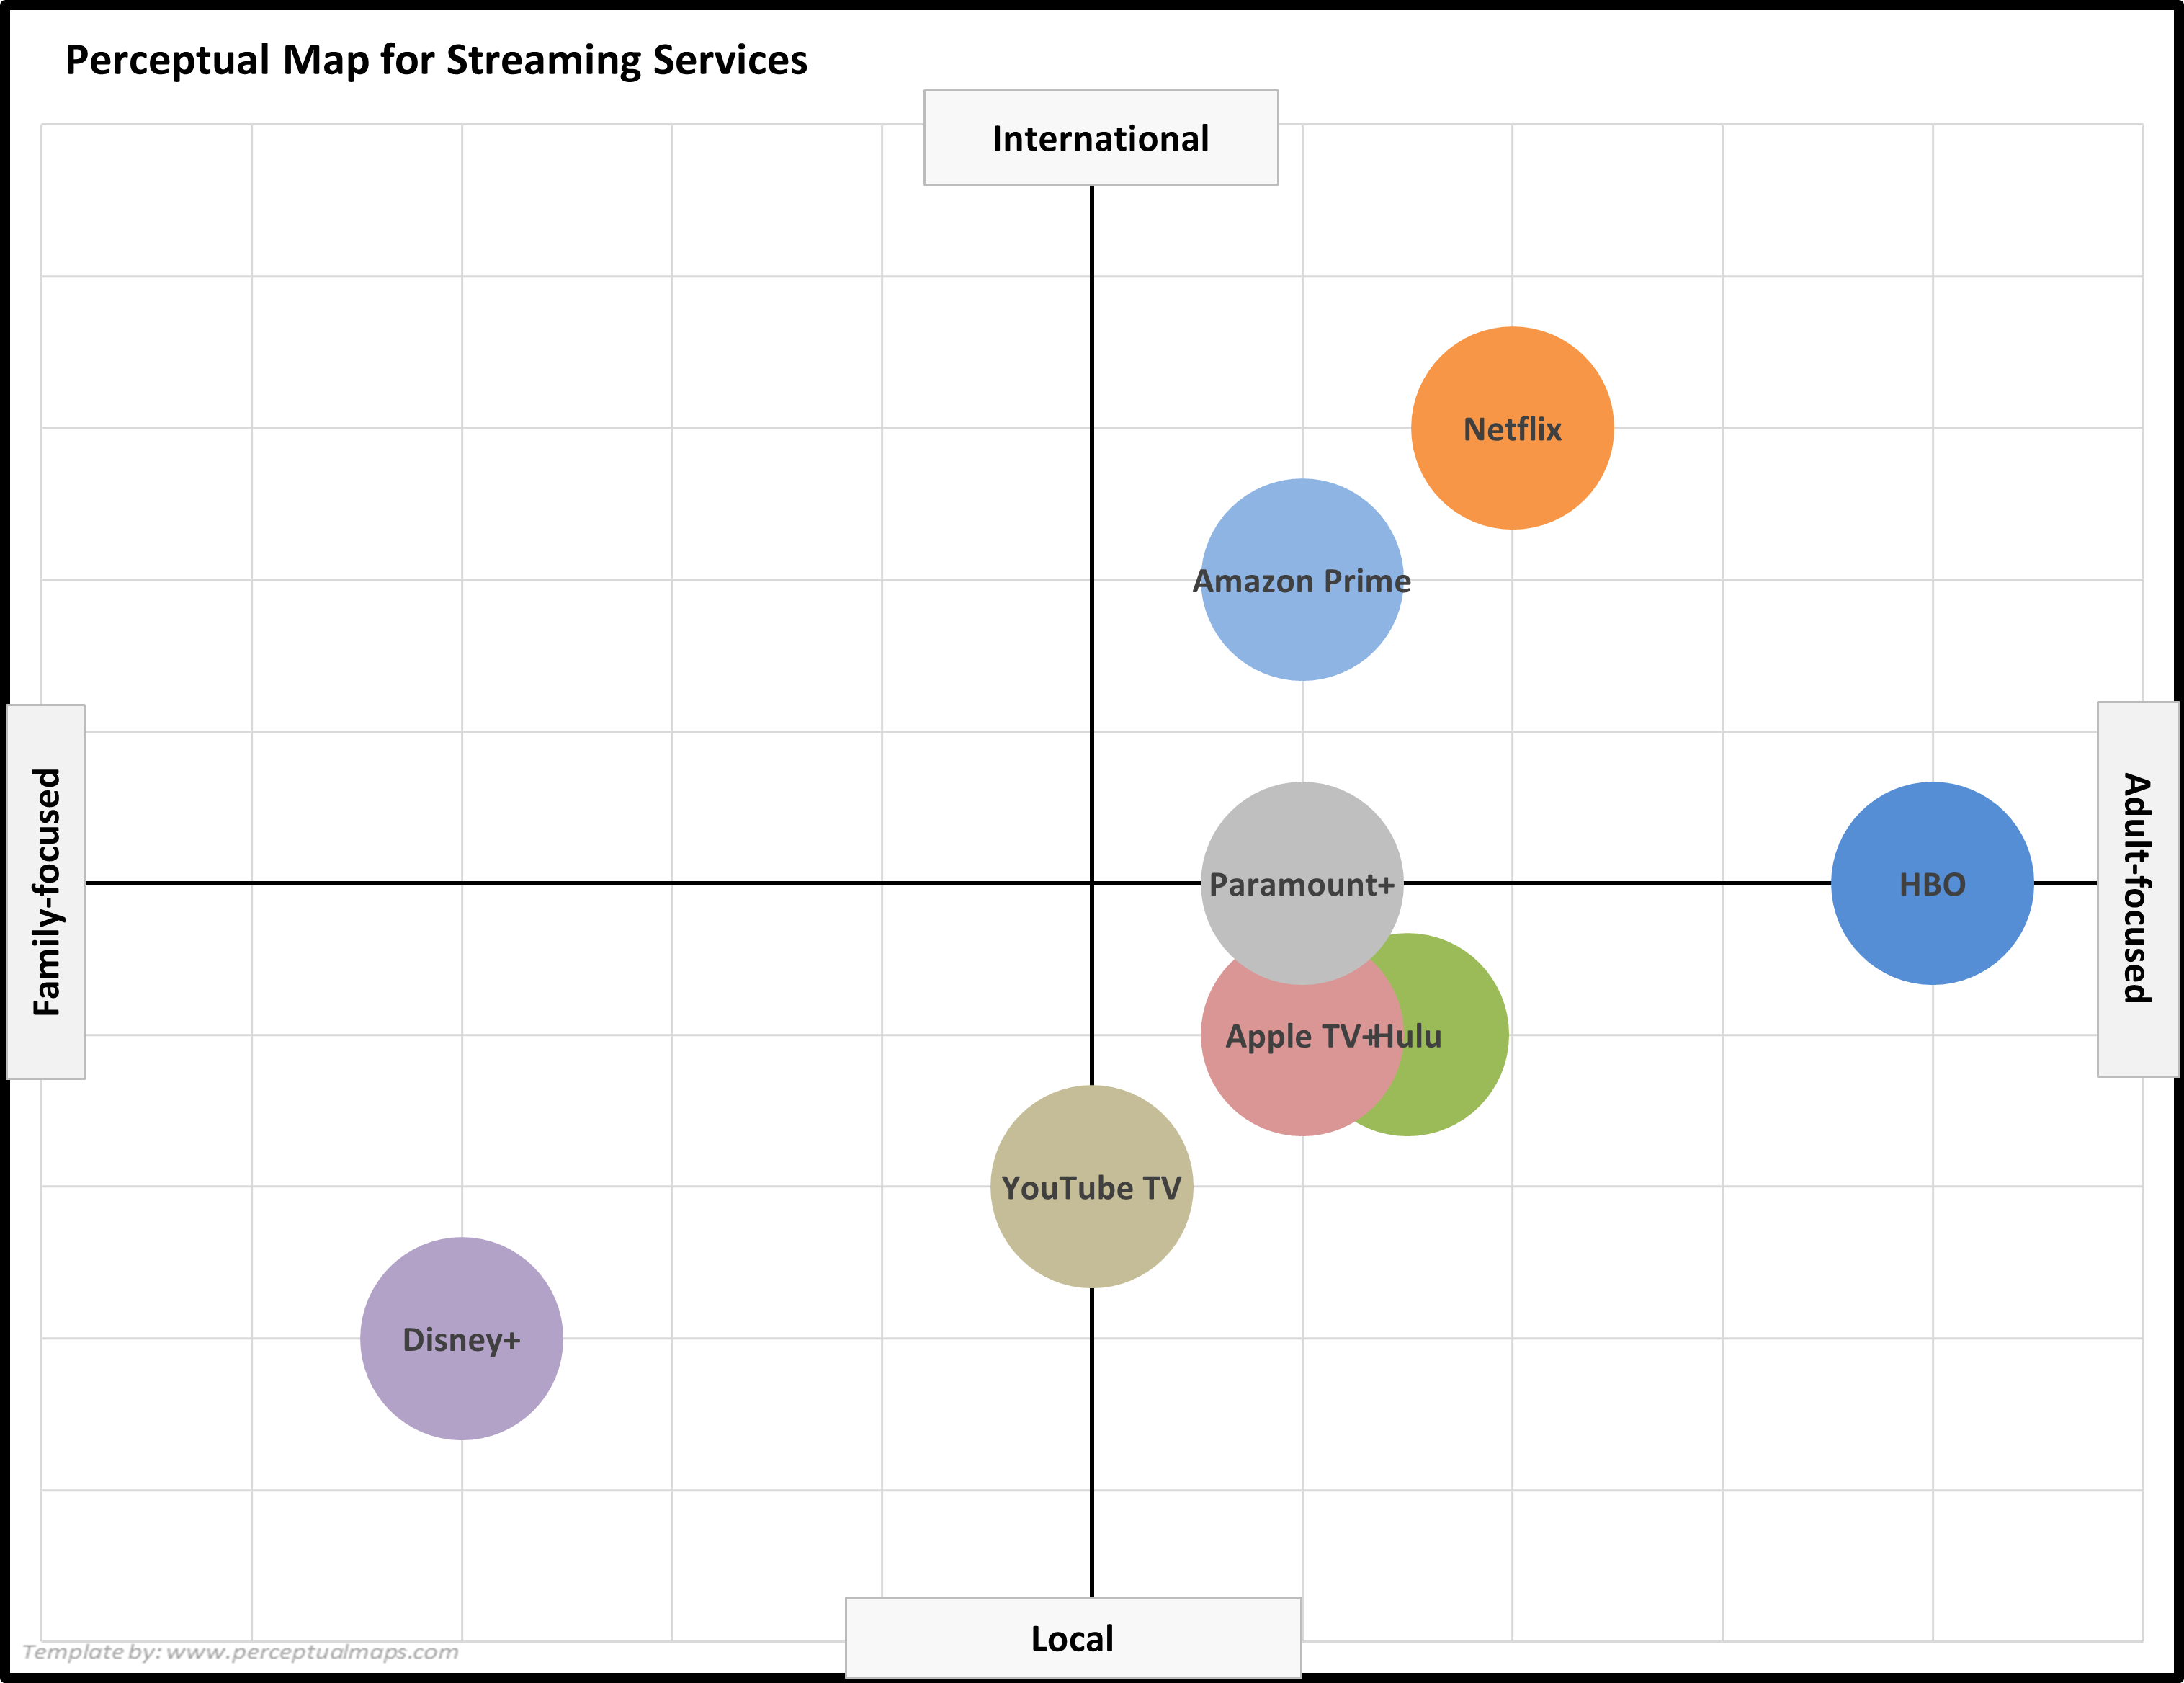
EXAMPLE: And One More Perceptual Map for Streaming Services
And here we have a third example perceptual map for Streaming Services. This time we are using two different axis attributes – which, in turn, again creates a unique and different map – giving us more insight into the various brands and positioning strategies in this market.
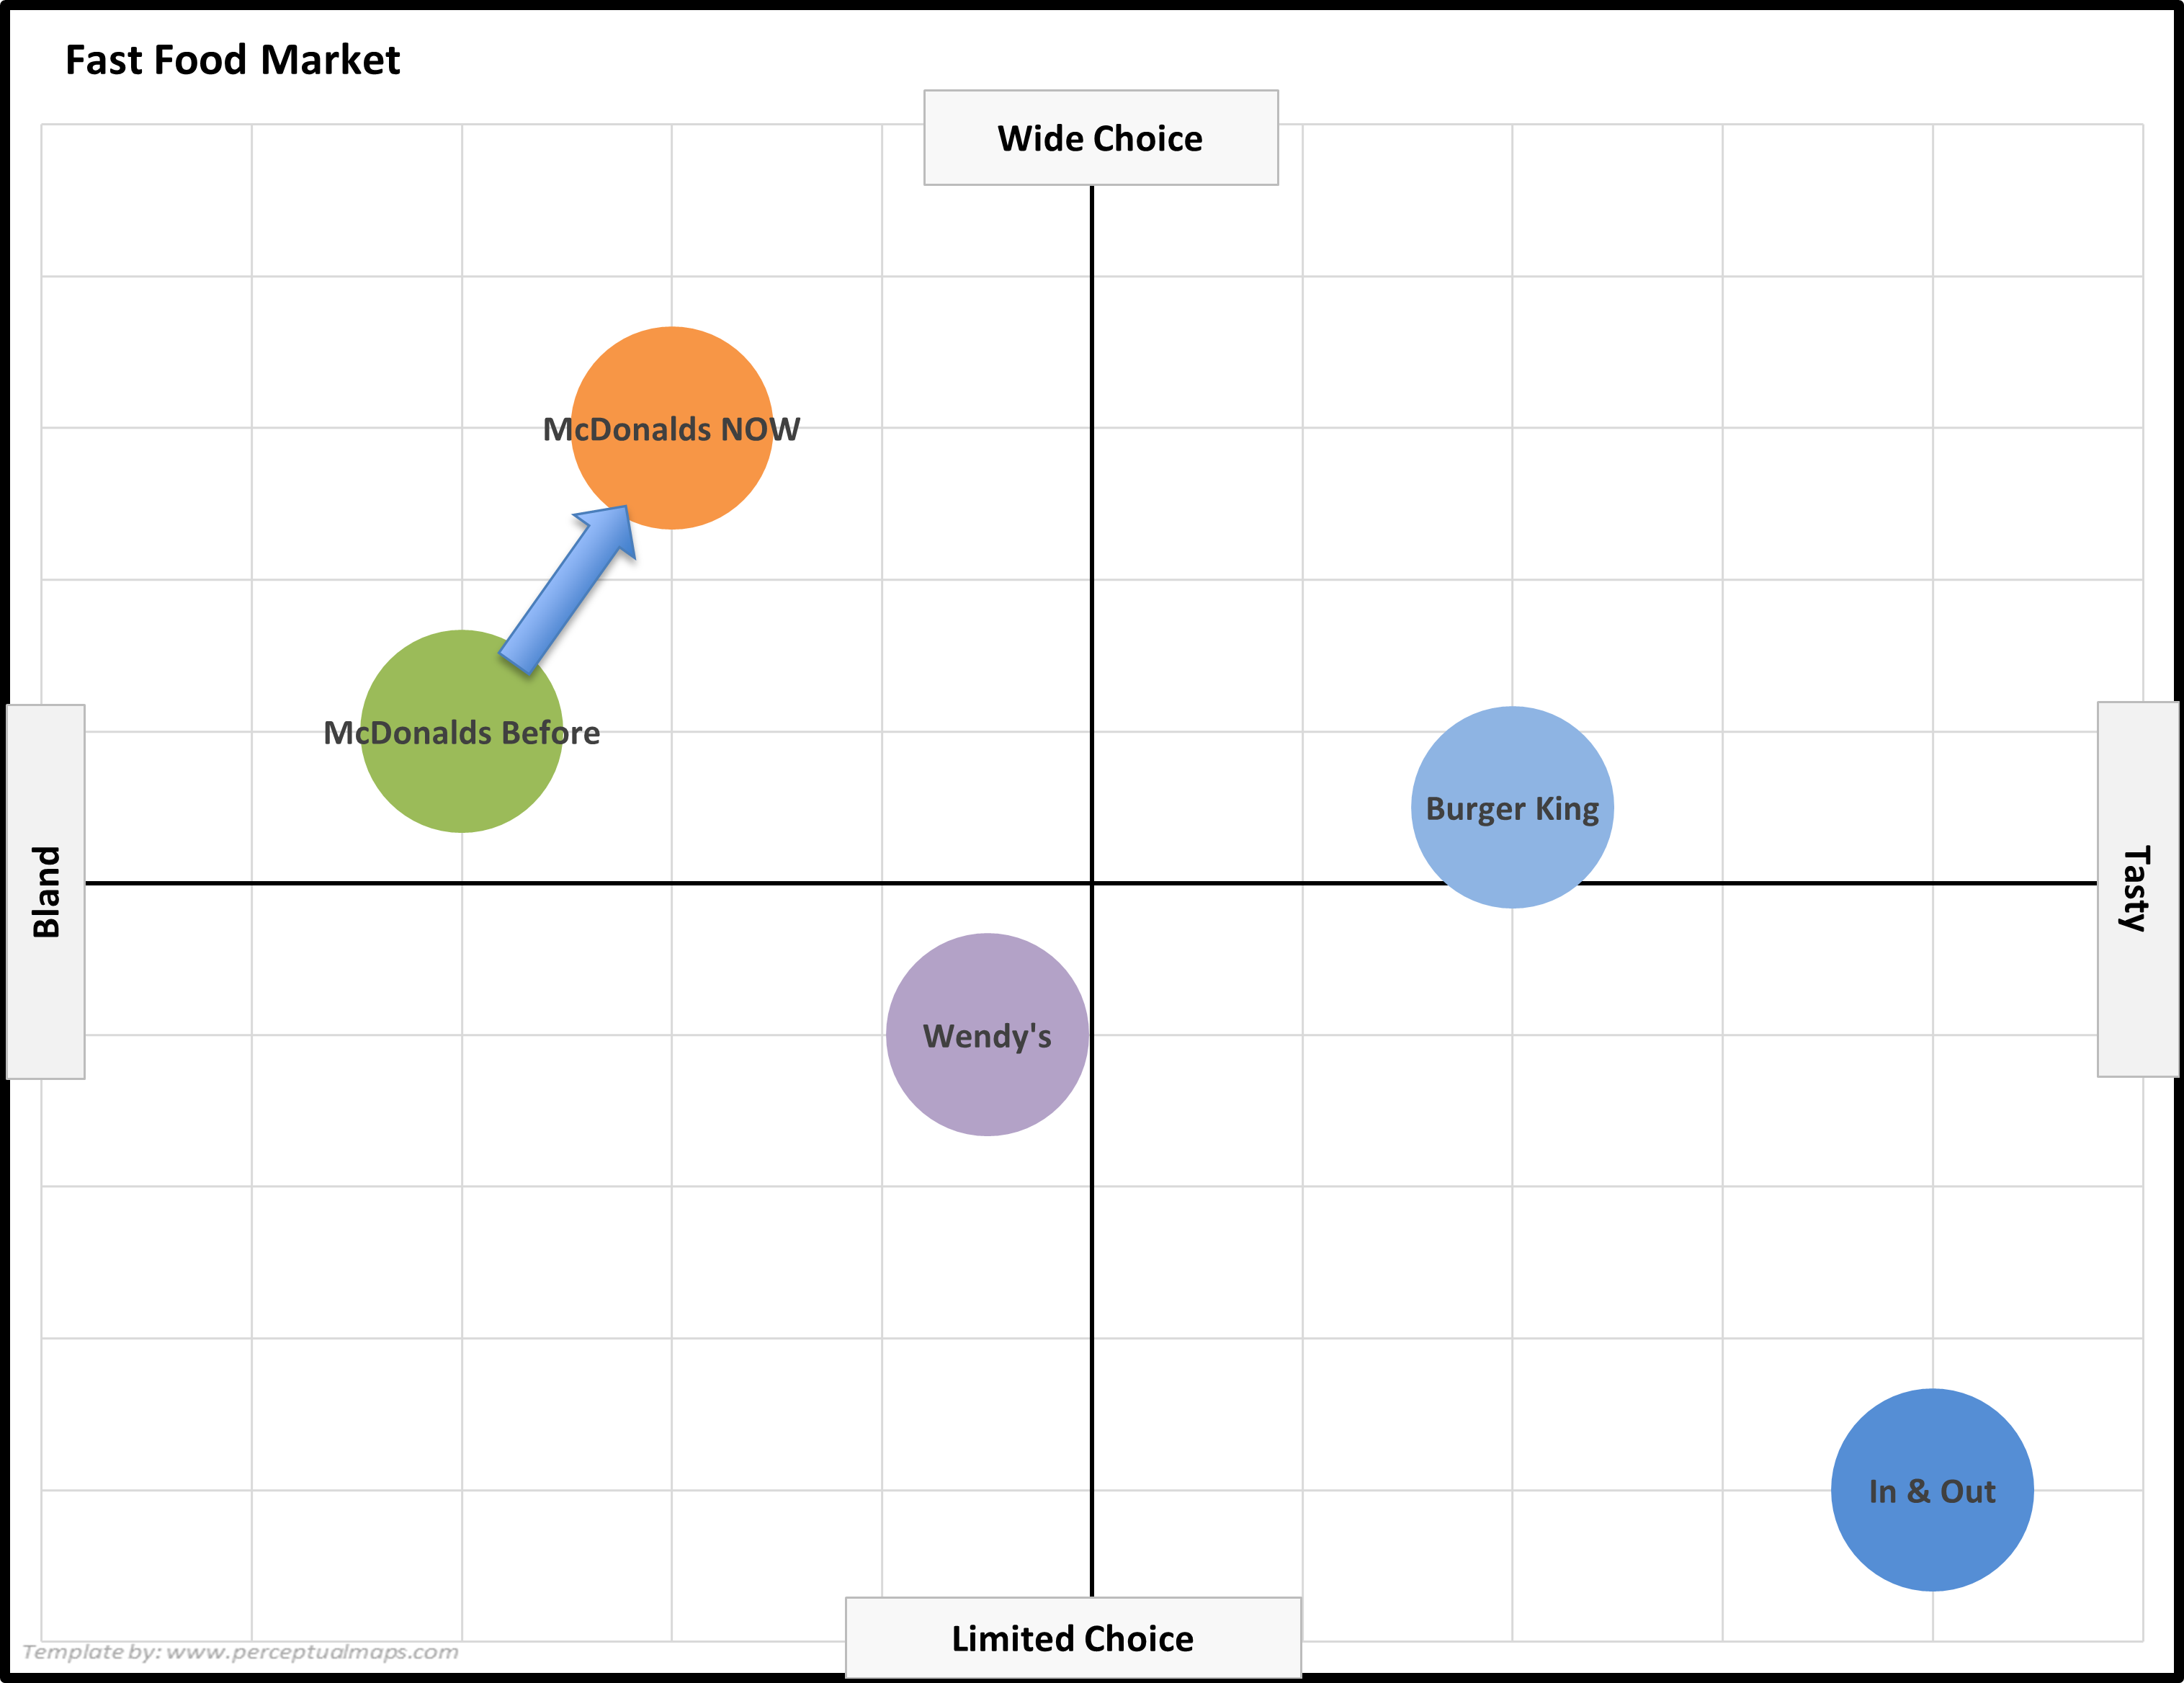
EXAMPLE: Using Perceptual Maps to Show Positioning Changes = Repositioning
In this example map, we are using a before/after technique (that is, prior to current positioning) to show how a brand’s positioning is evolving over time.
In this case, we can see the before/after positioning of McDonalds – where they have repositioned their brand toward “wide choice”, as well as drifting more to “tasty” as well.
By looking at changing brand positions over time, we can gain valuable insight it the success of our positioning strategy, as well as analyzing competitor strategies.
For more information, please review: How to Analyze Perceptual Maps
Two More Repositioning Examples, as Shows on Perceptual Maps
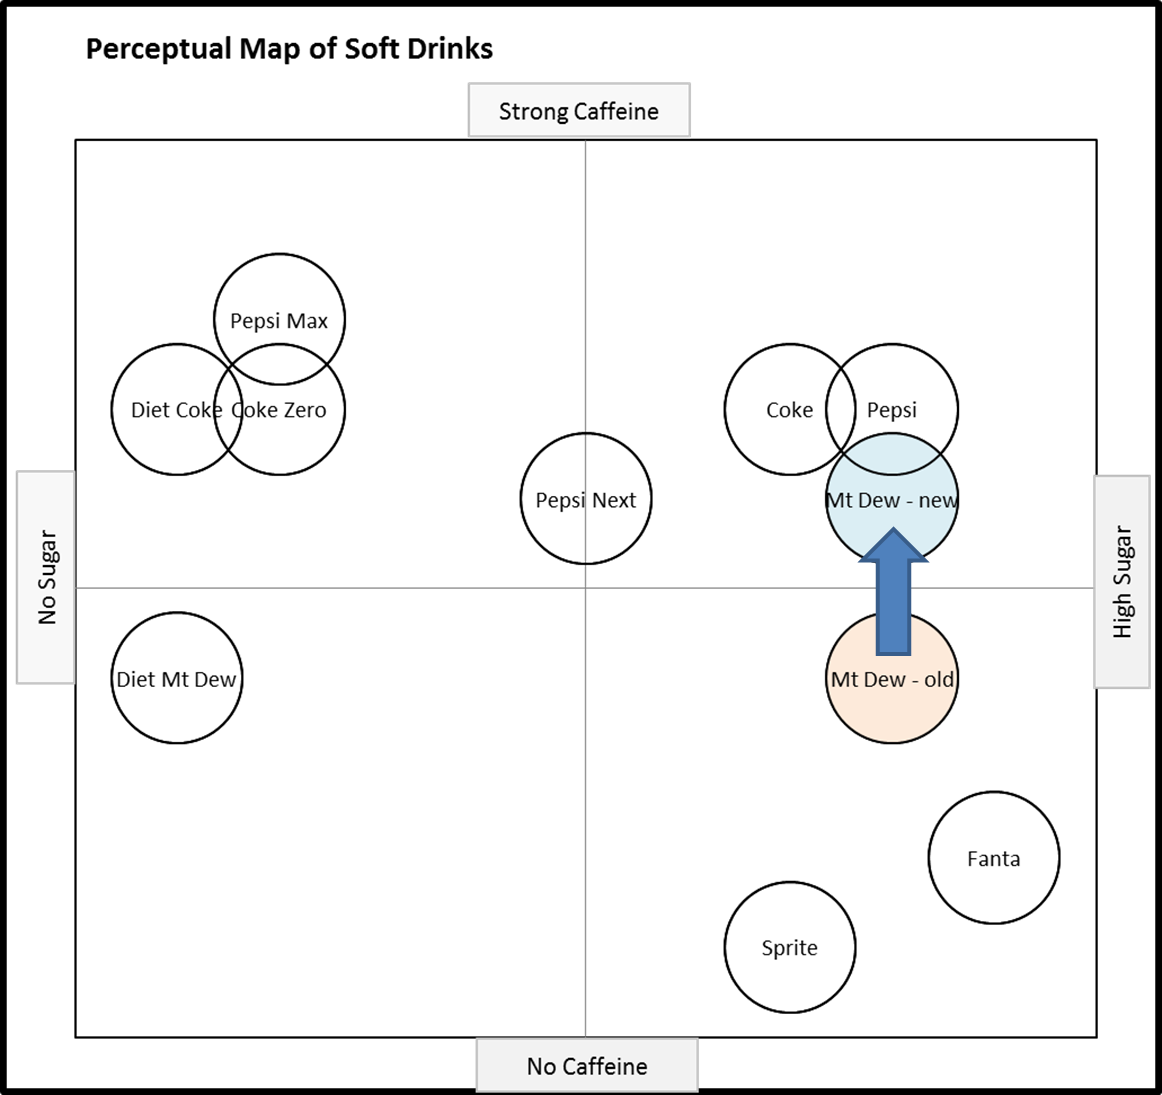
Here are two more examples of repositioning, this time for the soda (soft drink) market. In the first map, we can see Mt. Dew repositioned (in the mind of the consumer) toward ‘strong caffeine’. This is most likely a deliberate repositioning effort, to tap into the consumer’s need for an energy boost.
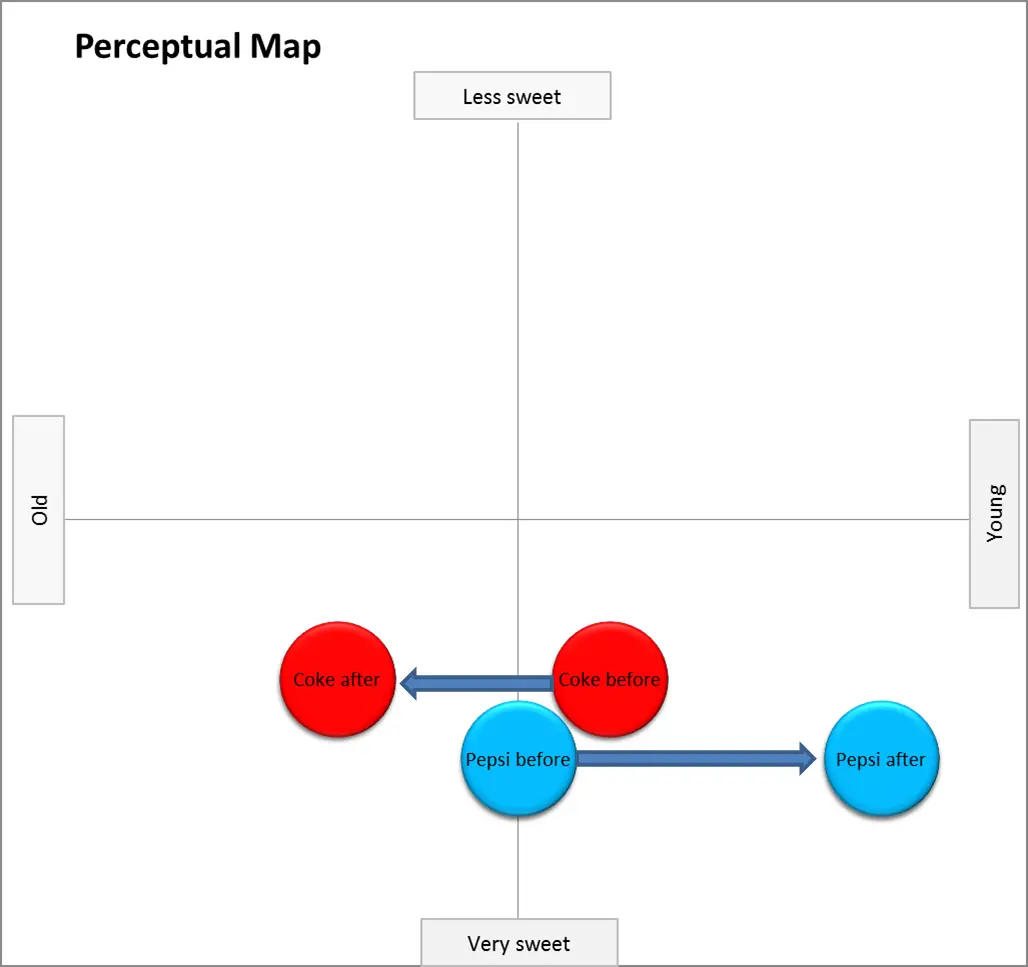
But the following repositioning perceptual map highlights how a competitor’s efforts can reposition our brand. In this example, Pepsi’s “Choice of a New Generation” campaign had the effect of repositioning Coke as an old and tired brand.
This shows that Coke’s repositioning was NOT driven by Coke, but by its rival Pepsi.
Further reading:
EXAMPLE: Using Perceptual Maps to Show Different Competitive Sets
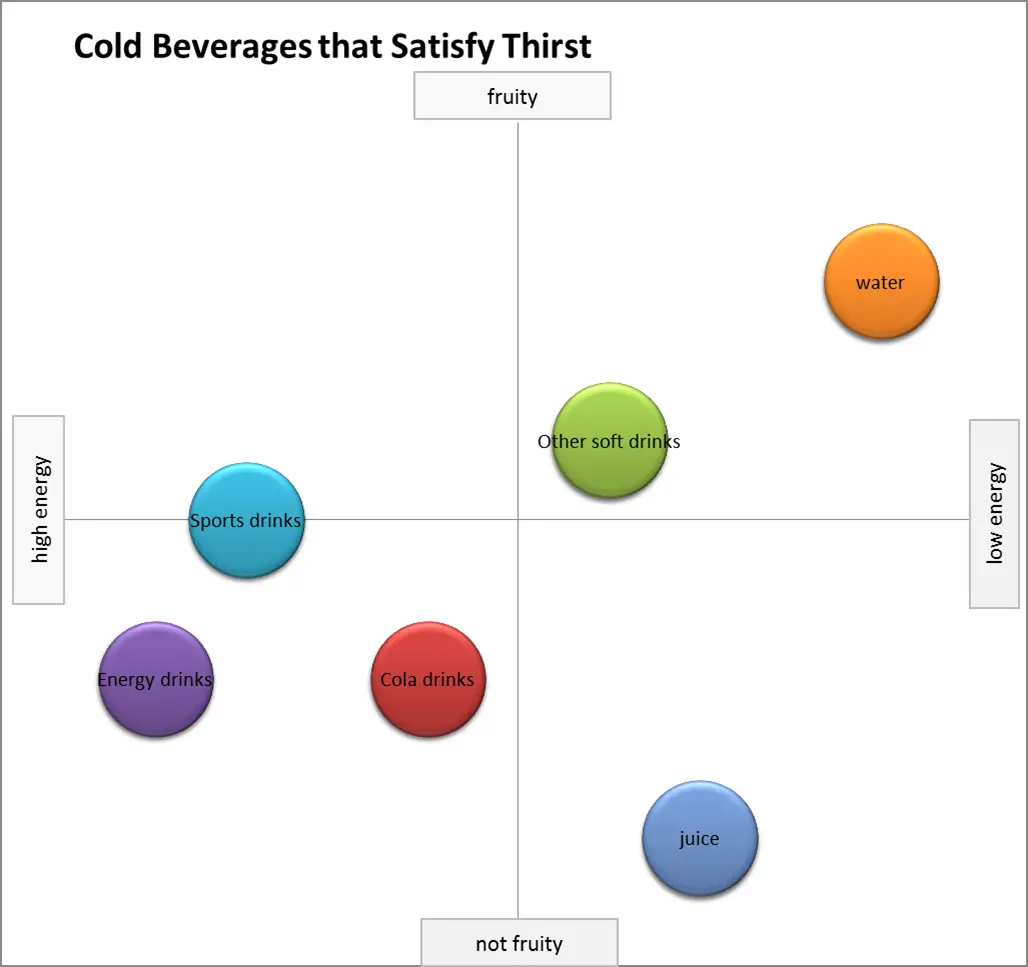
One of the main benefits of a perceptual map is to demonstrate how the brand is positioned against competitors. In the following perceptual map examples, Coca-Cola is shown in different competitive sets. This gives a very quick overview of their direct and indirect competition.
Please note that you can further review the concept of competitive sets here.
In this example map, Coke is compared at a “need-level” against other BEVERAGE categories that also satisfy thirst.
And in this example map, Coke is now compared at a higher “need-level”, this time against other PRODUCT (food) BEVERAGE categories that also satisfy thirst expanding into products such as ice-cream and soup.
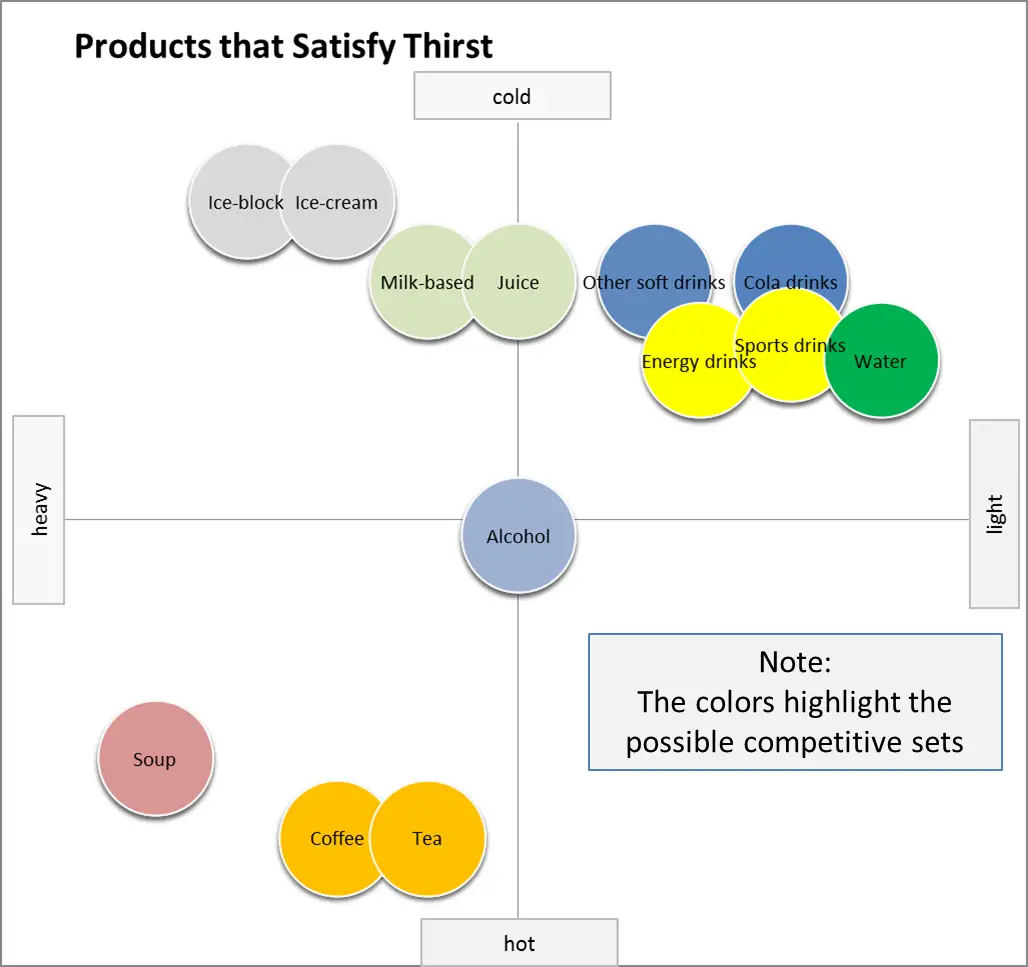
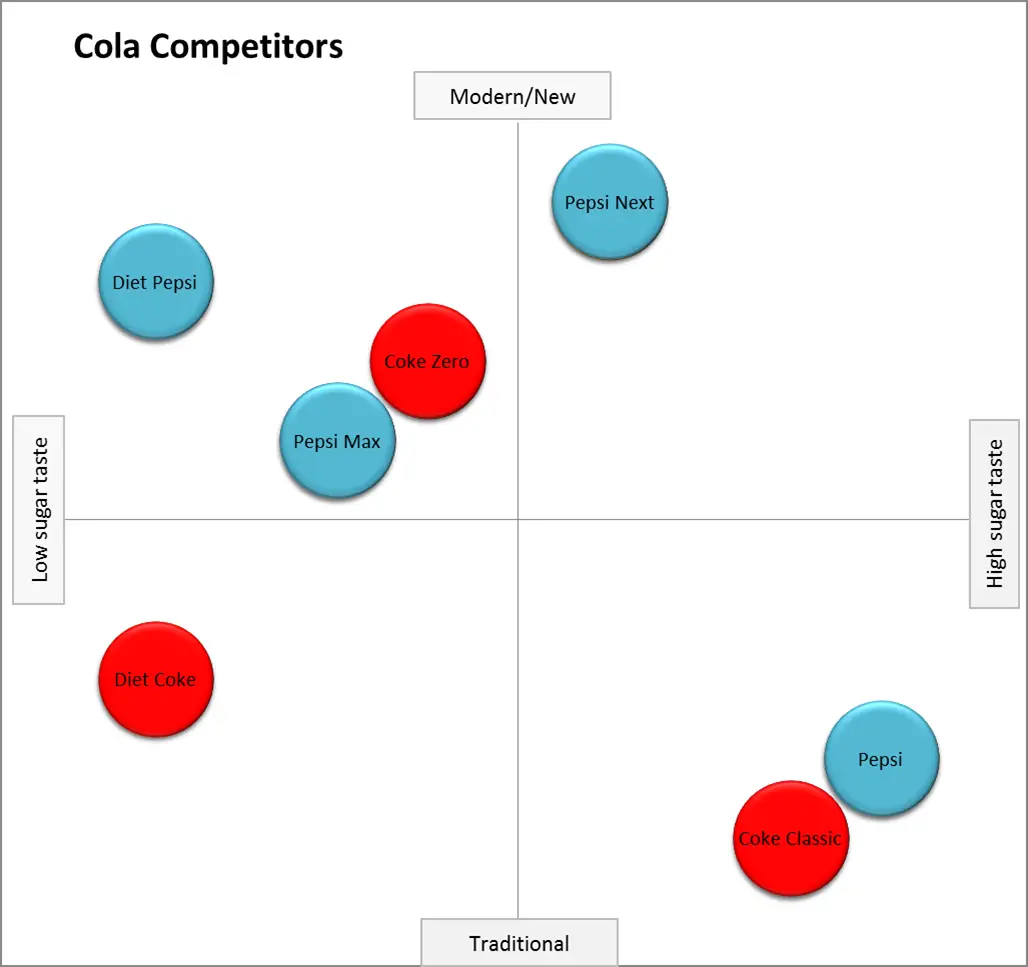
And in this more “traditional” perceptual map, Coke is shown against other direct competitors at the brand level, but with the color indicating corporate ownership (Coke = red, Pepsi = blue).
This corporate brand mapping gives a good sense and insight to the firm’s overall positioning game plan – and we can see “how they choose to compete” and we may be able to identify their next positioning moves.
Perceptual Map highlighting direct competitors
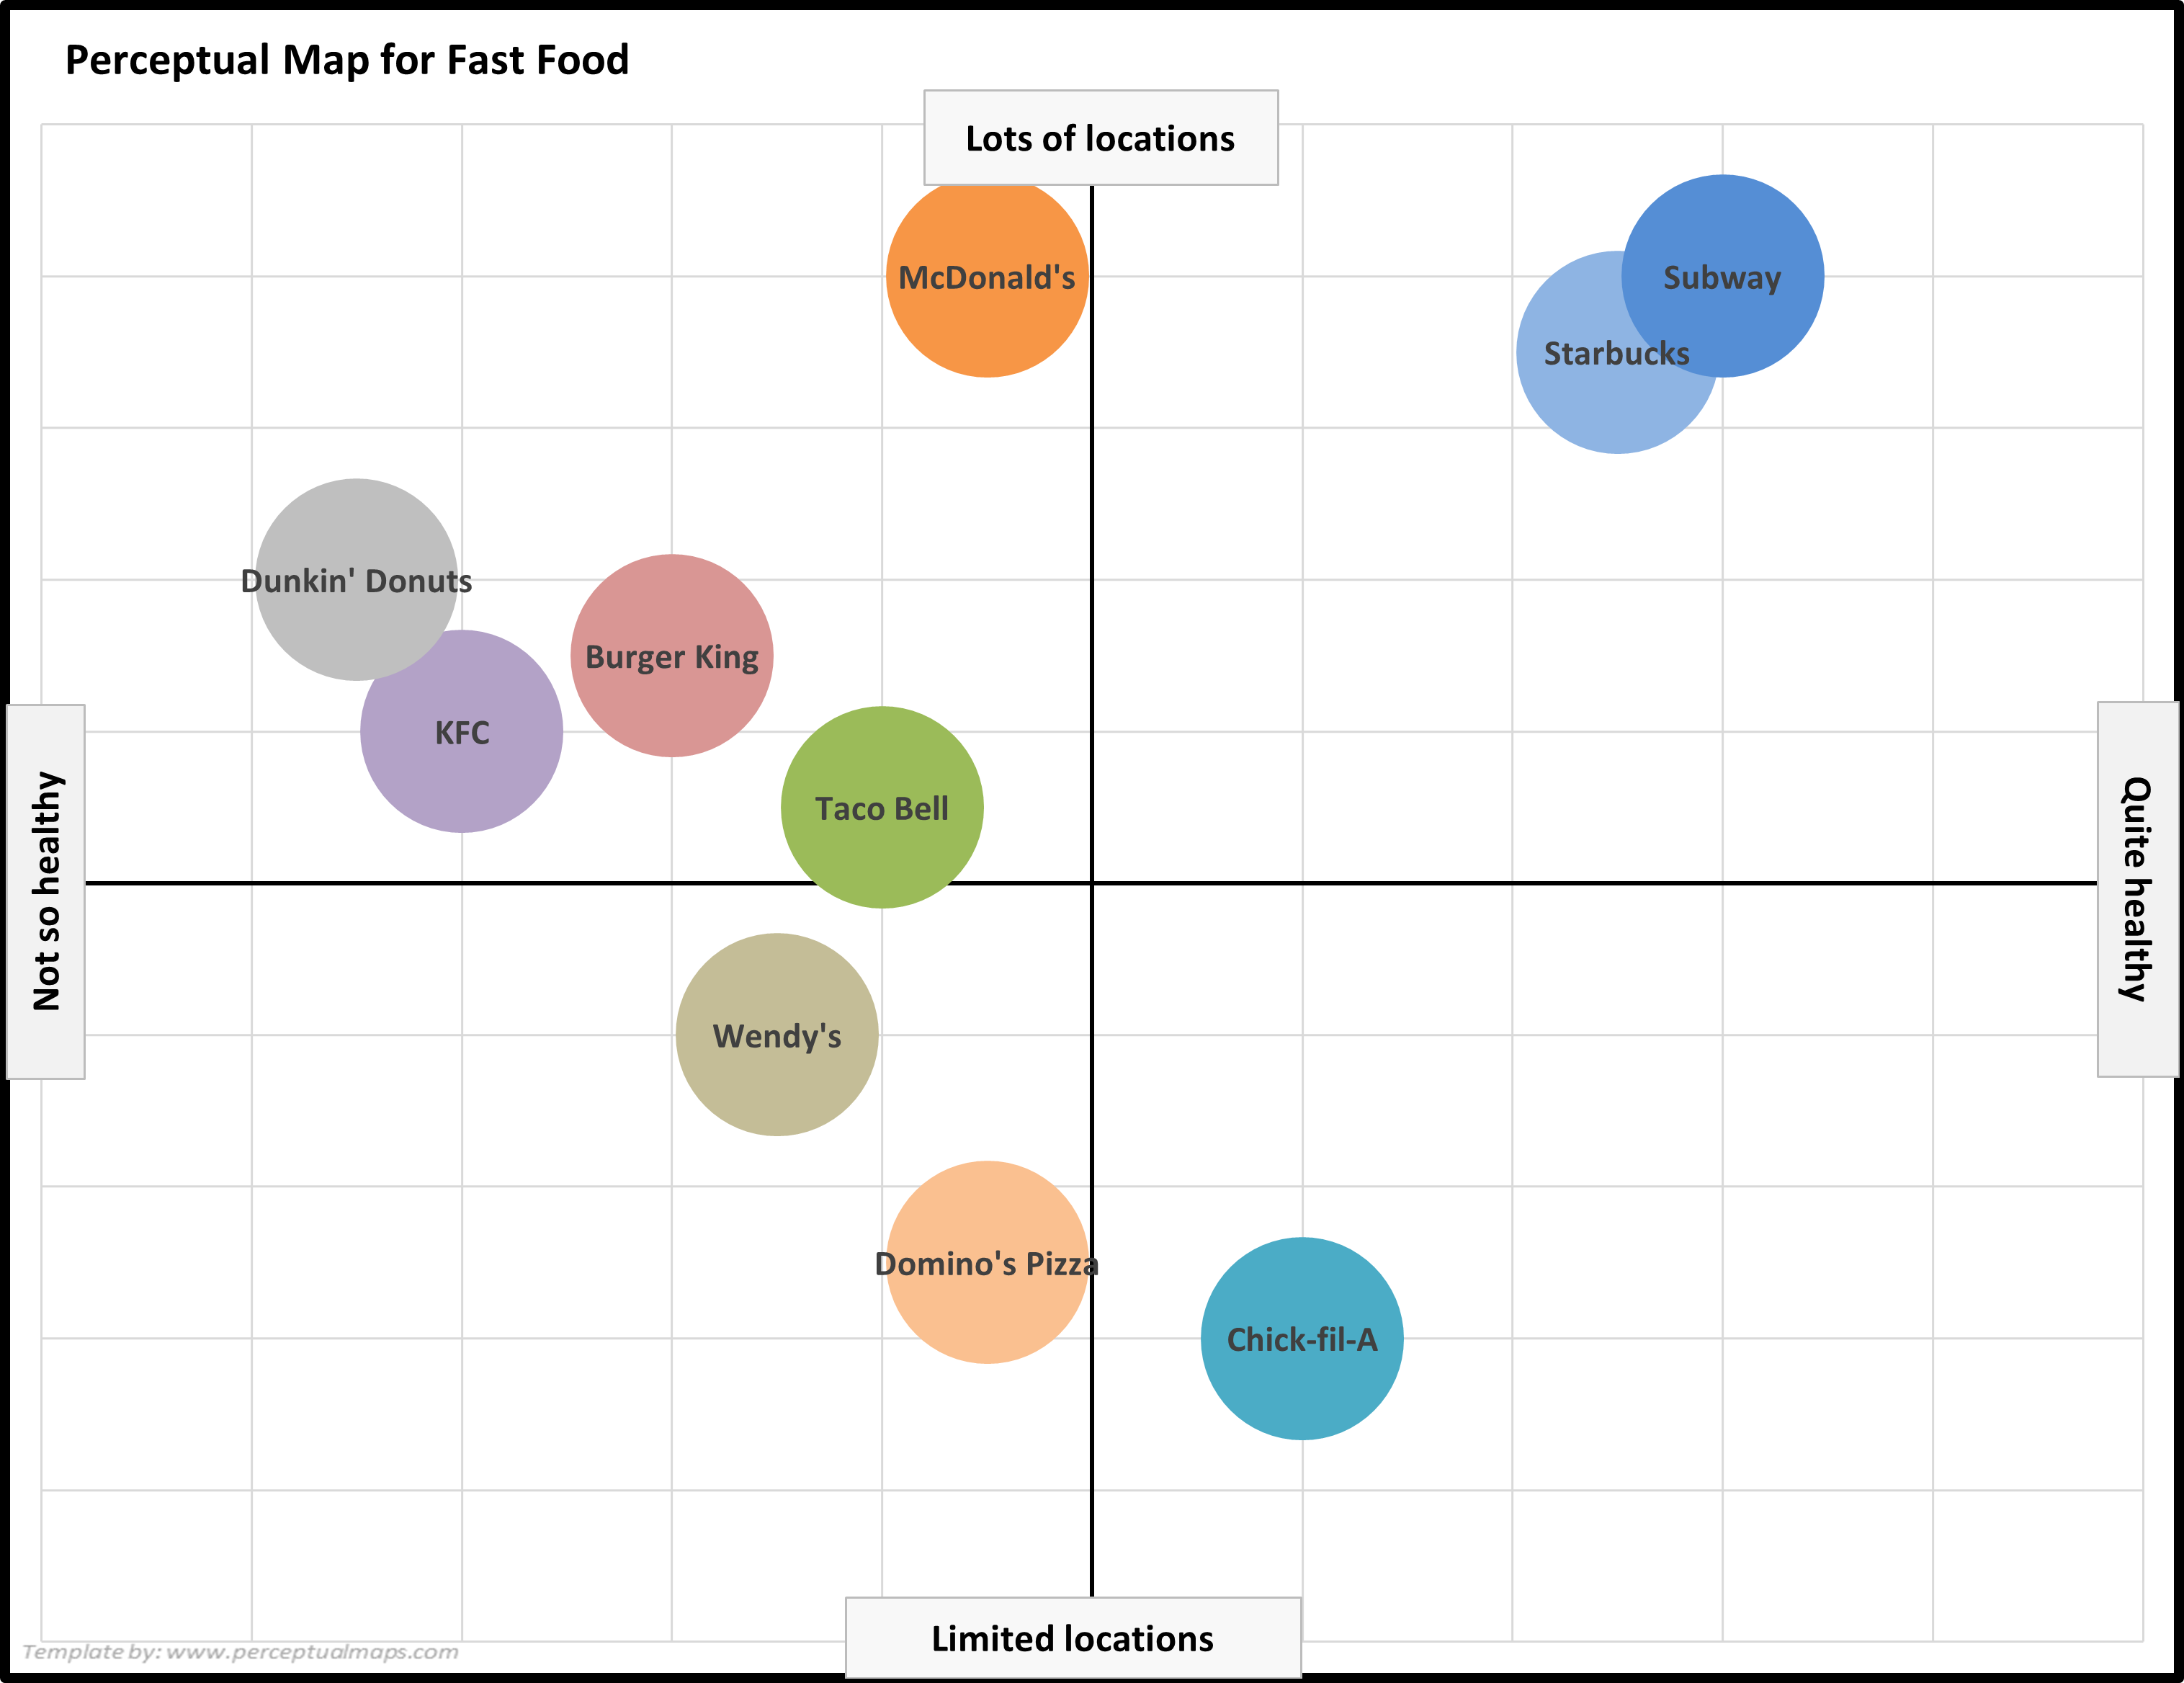
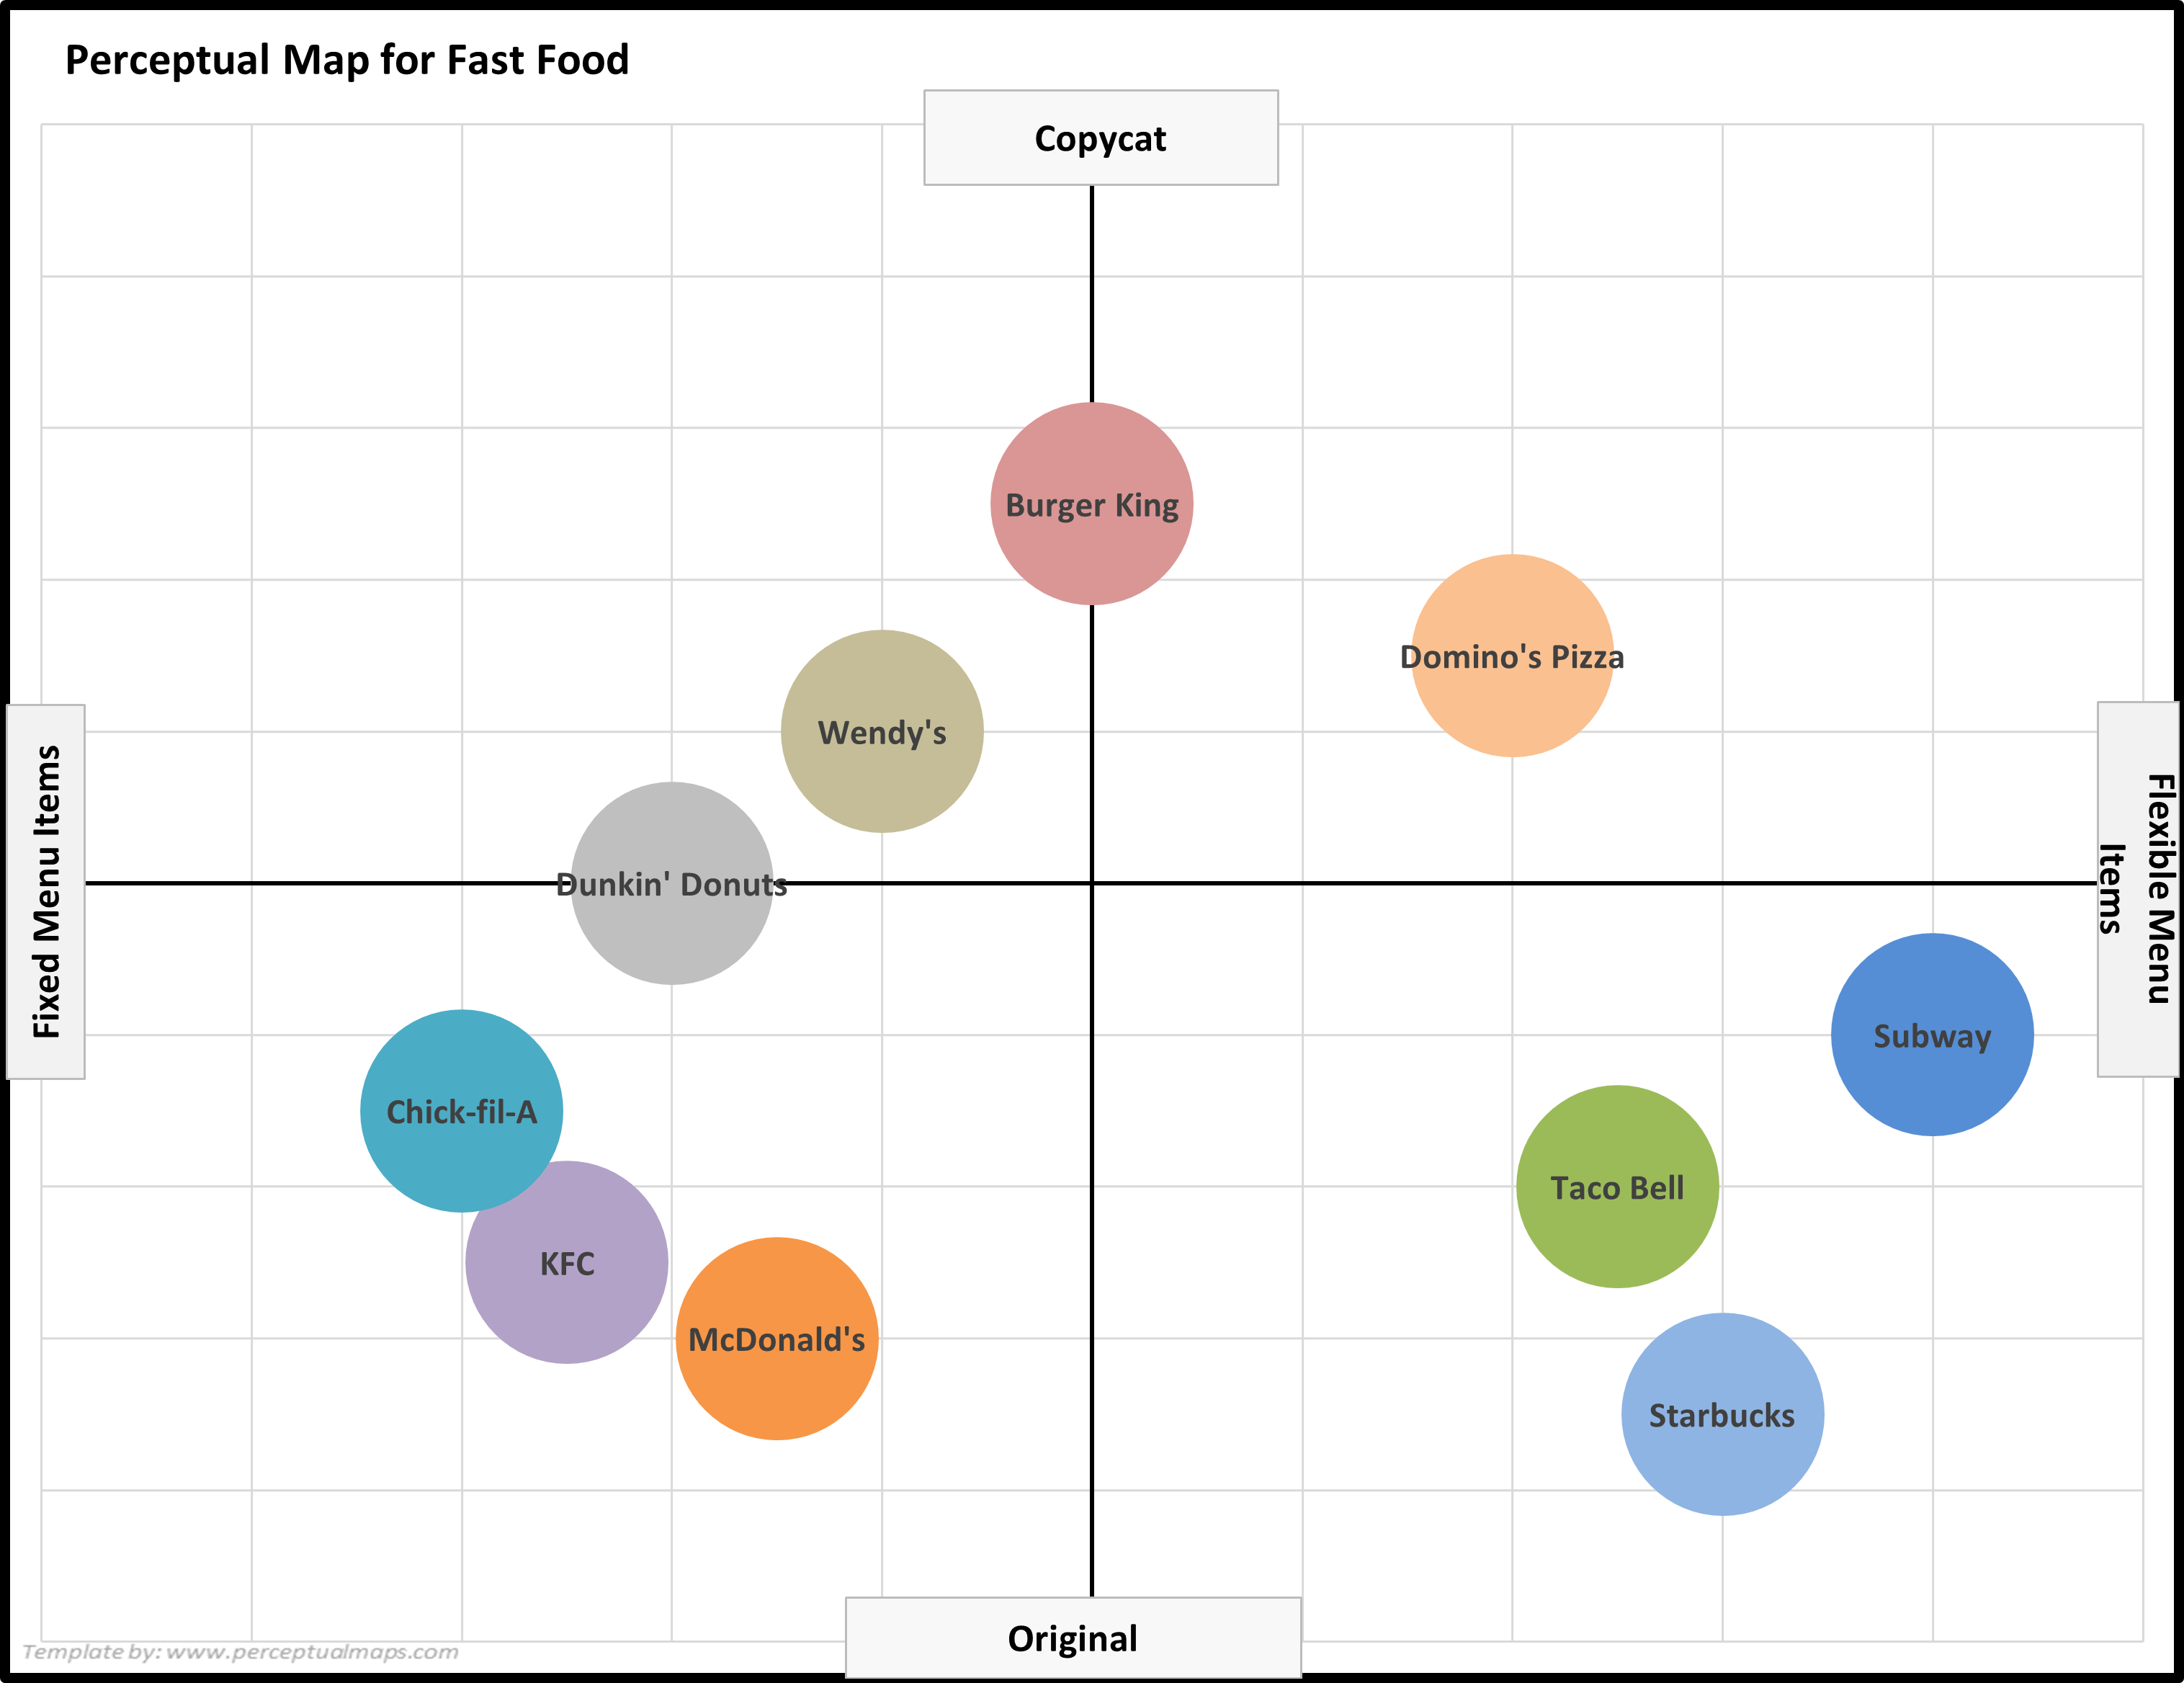
EXAMPLE Perceptual Maps for the Fast Food Market
In this collection of example perceptual maps, the major fast food chains in the USA market have been mapped.
As you can see the most of major chains are presented, across multiple different product attributes. You should note how the competitors have a different positioning as new attributes are introduced in each map.
For further detail, please review: Example Perceptual Maps for Fast Food


EXAMPLE Perceptual Maps for the Soda (Soft Drink) Market
In this collection of example perceptual maps, the major soda/soft drink brands in the USA market have been mapped.
As you can see the most of major brands are presented, across multiple different product attributes. You should note how the competitors have a different positioning as new attributes are introduced in each map.
For further detail, please review: Example Perceptual Maps for Soda (Soft Drinks)
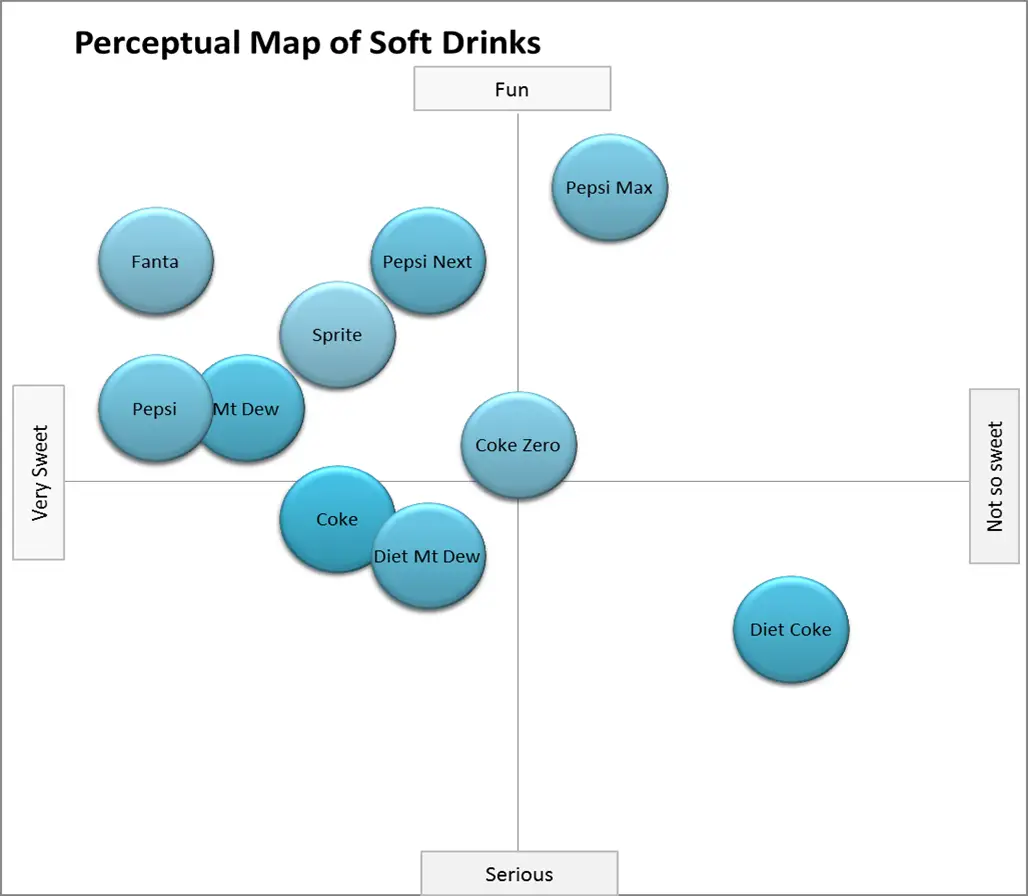
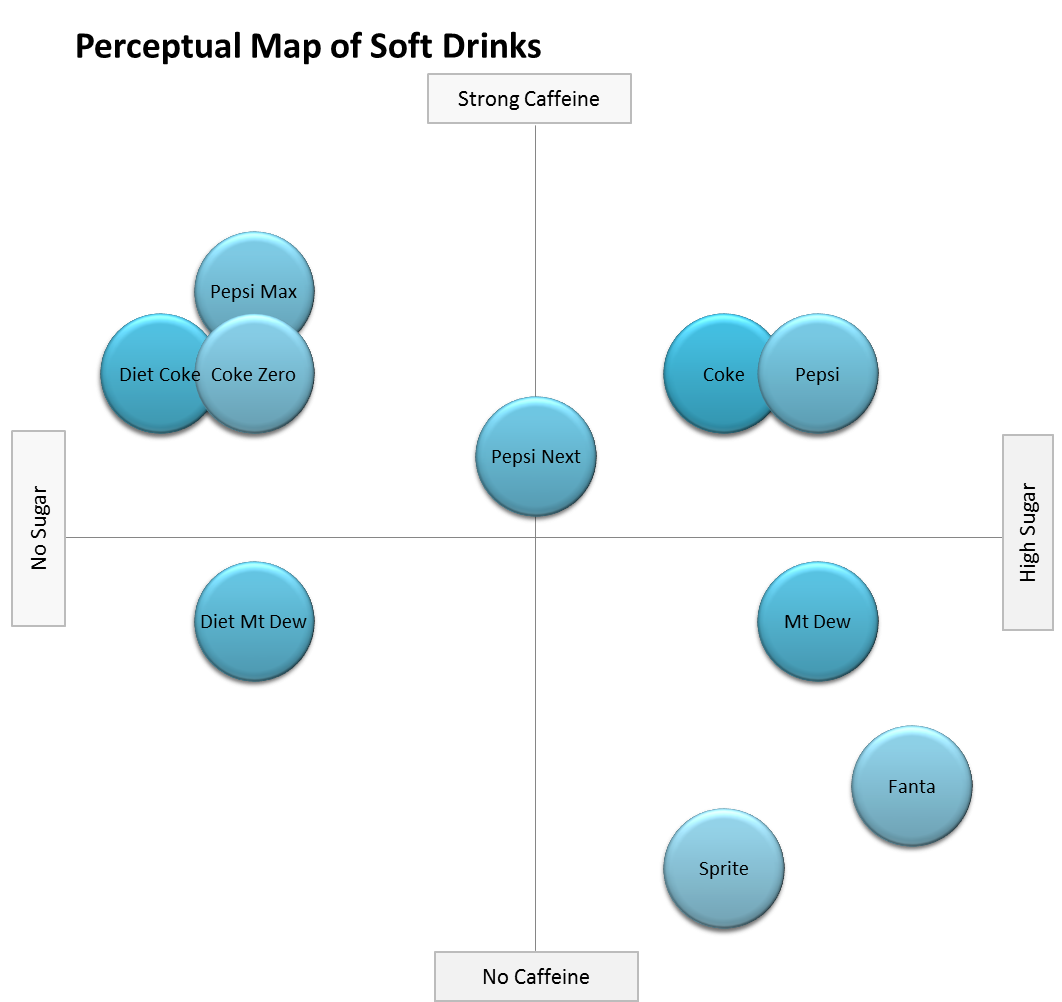


A perceptual map for the soft drink market, using taste and outlook
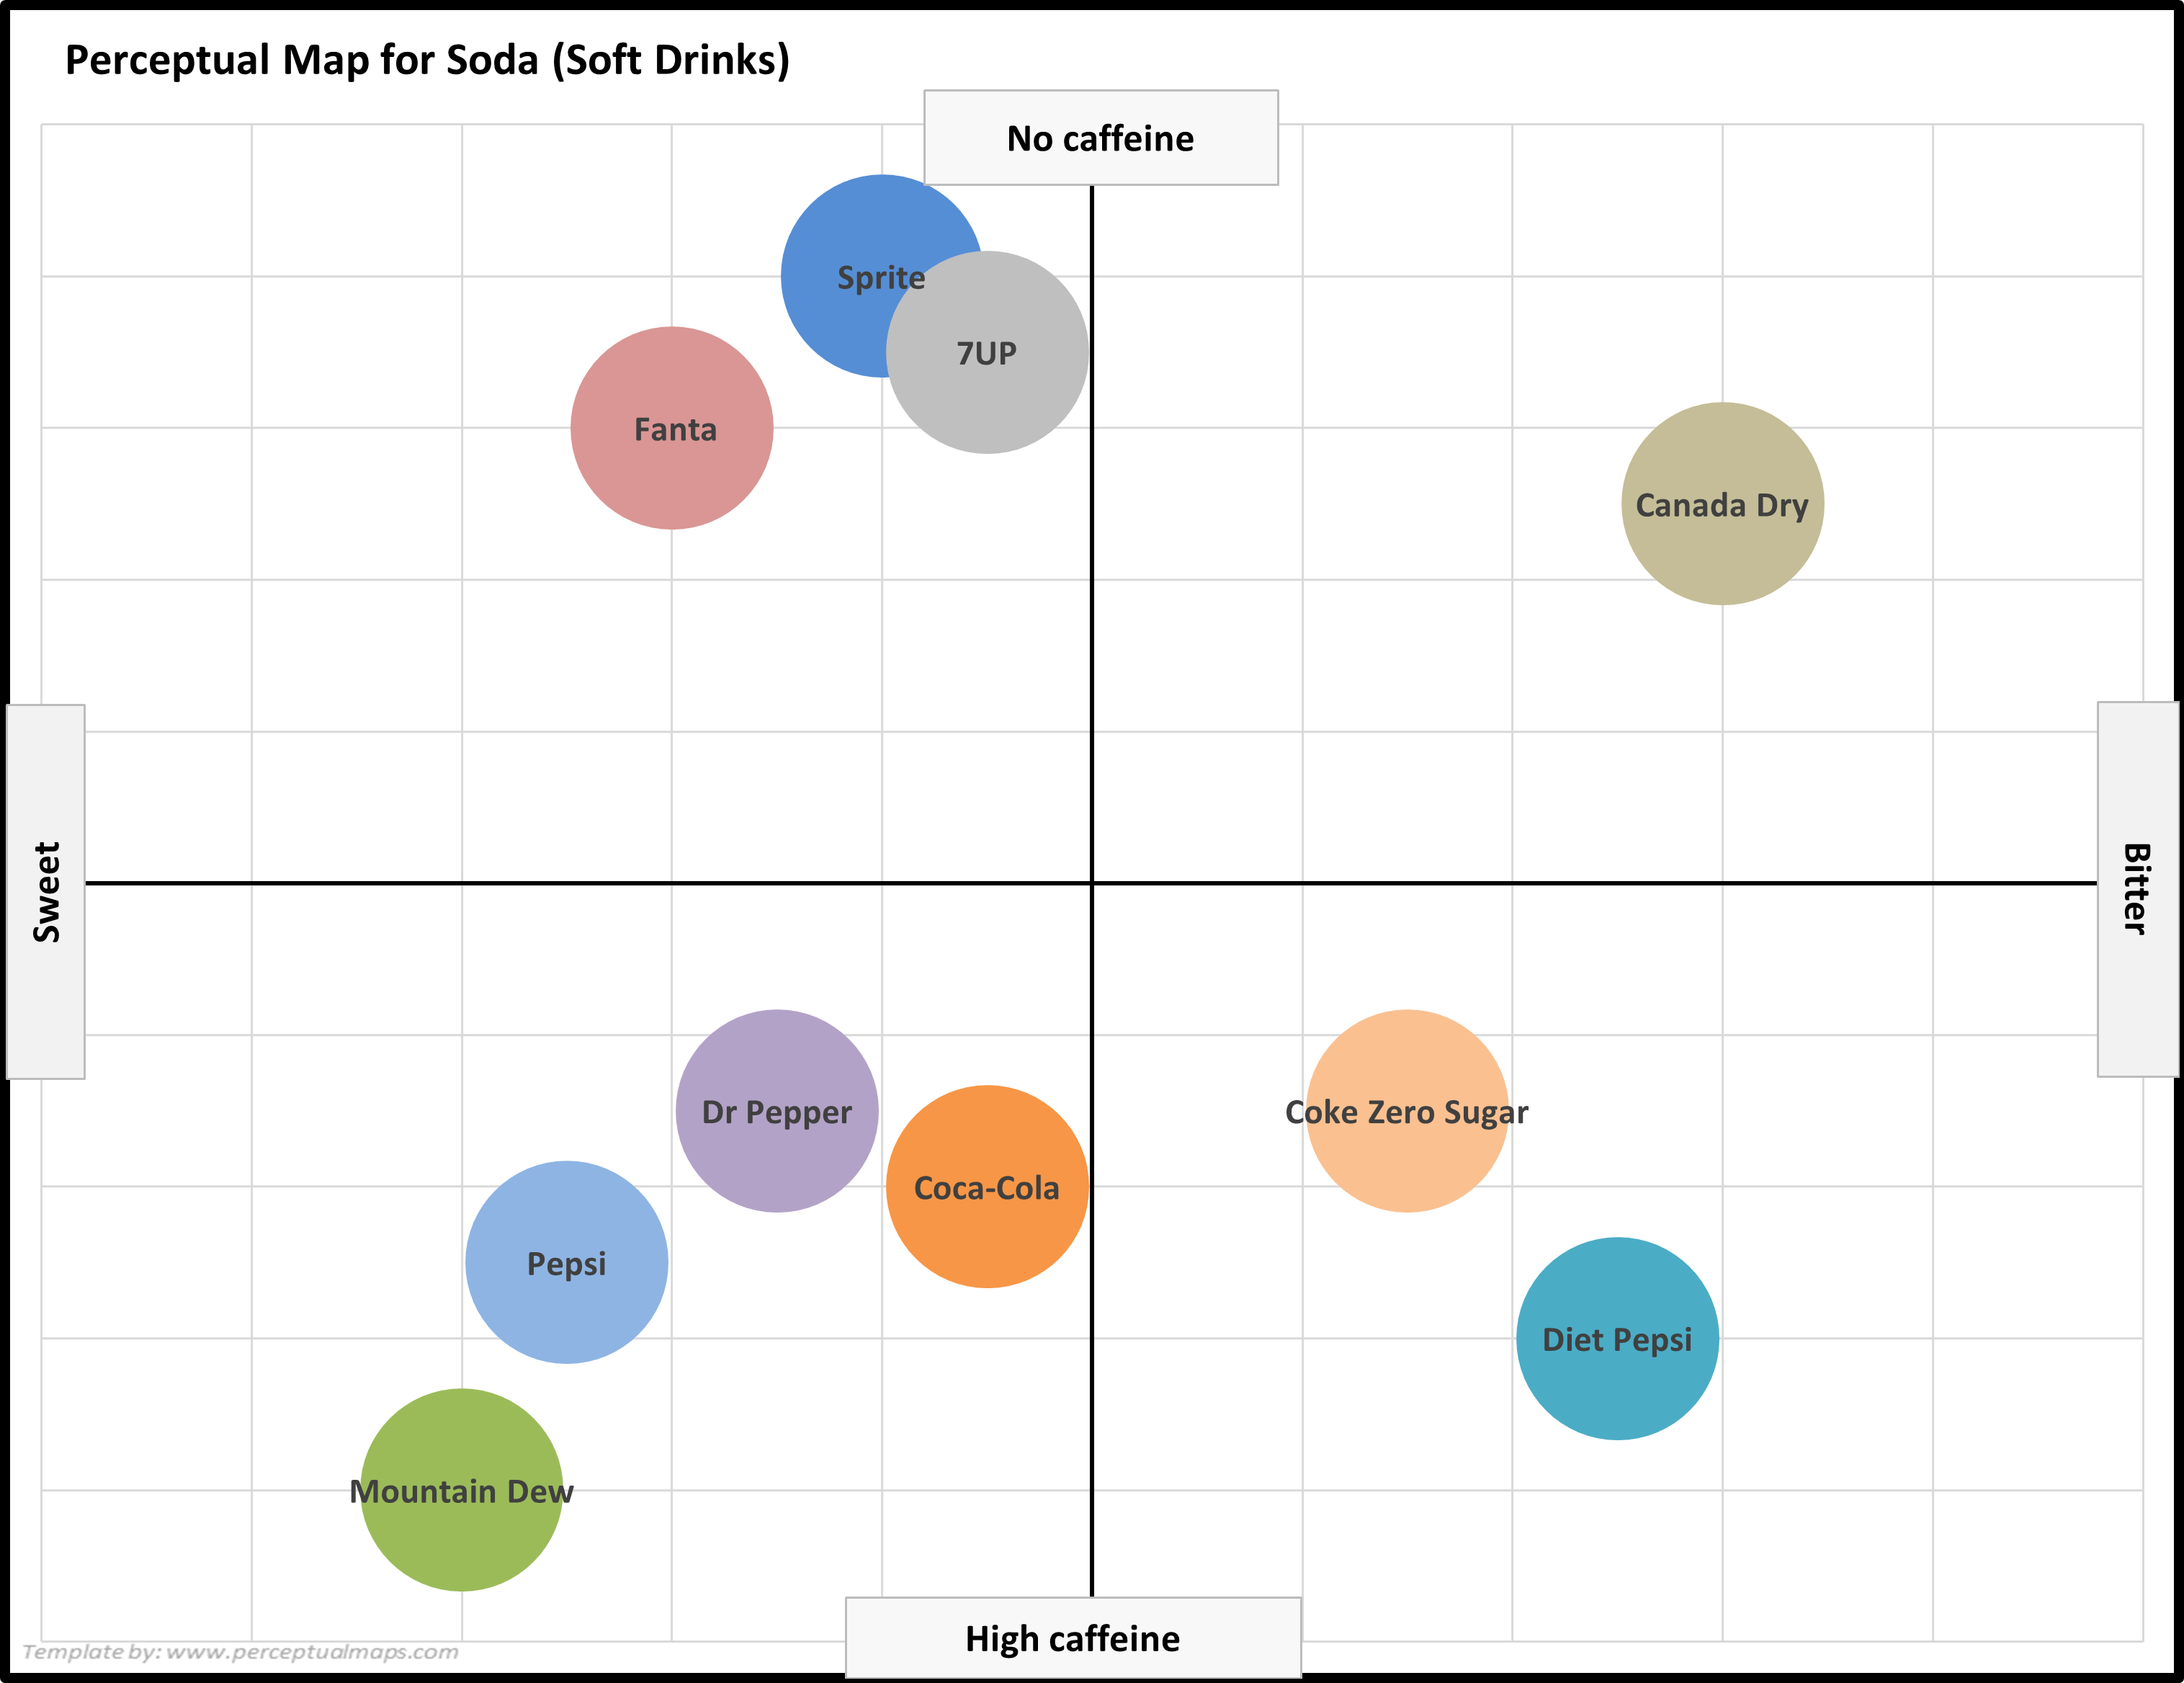
And this perceptual map for the soda market uses the attributes of caffeine level and sweet to bitter.
EXAMPLE Perceptual Maps for Car Brands
In this collection of example perceptual maps, the major car brand in the USA market have been mapped.


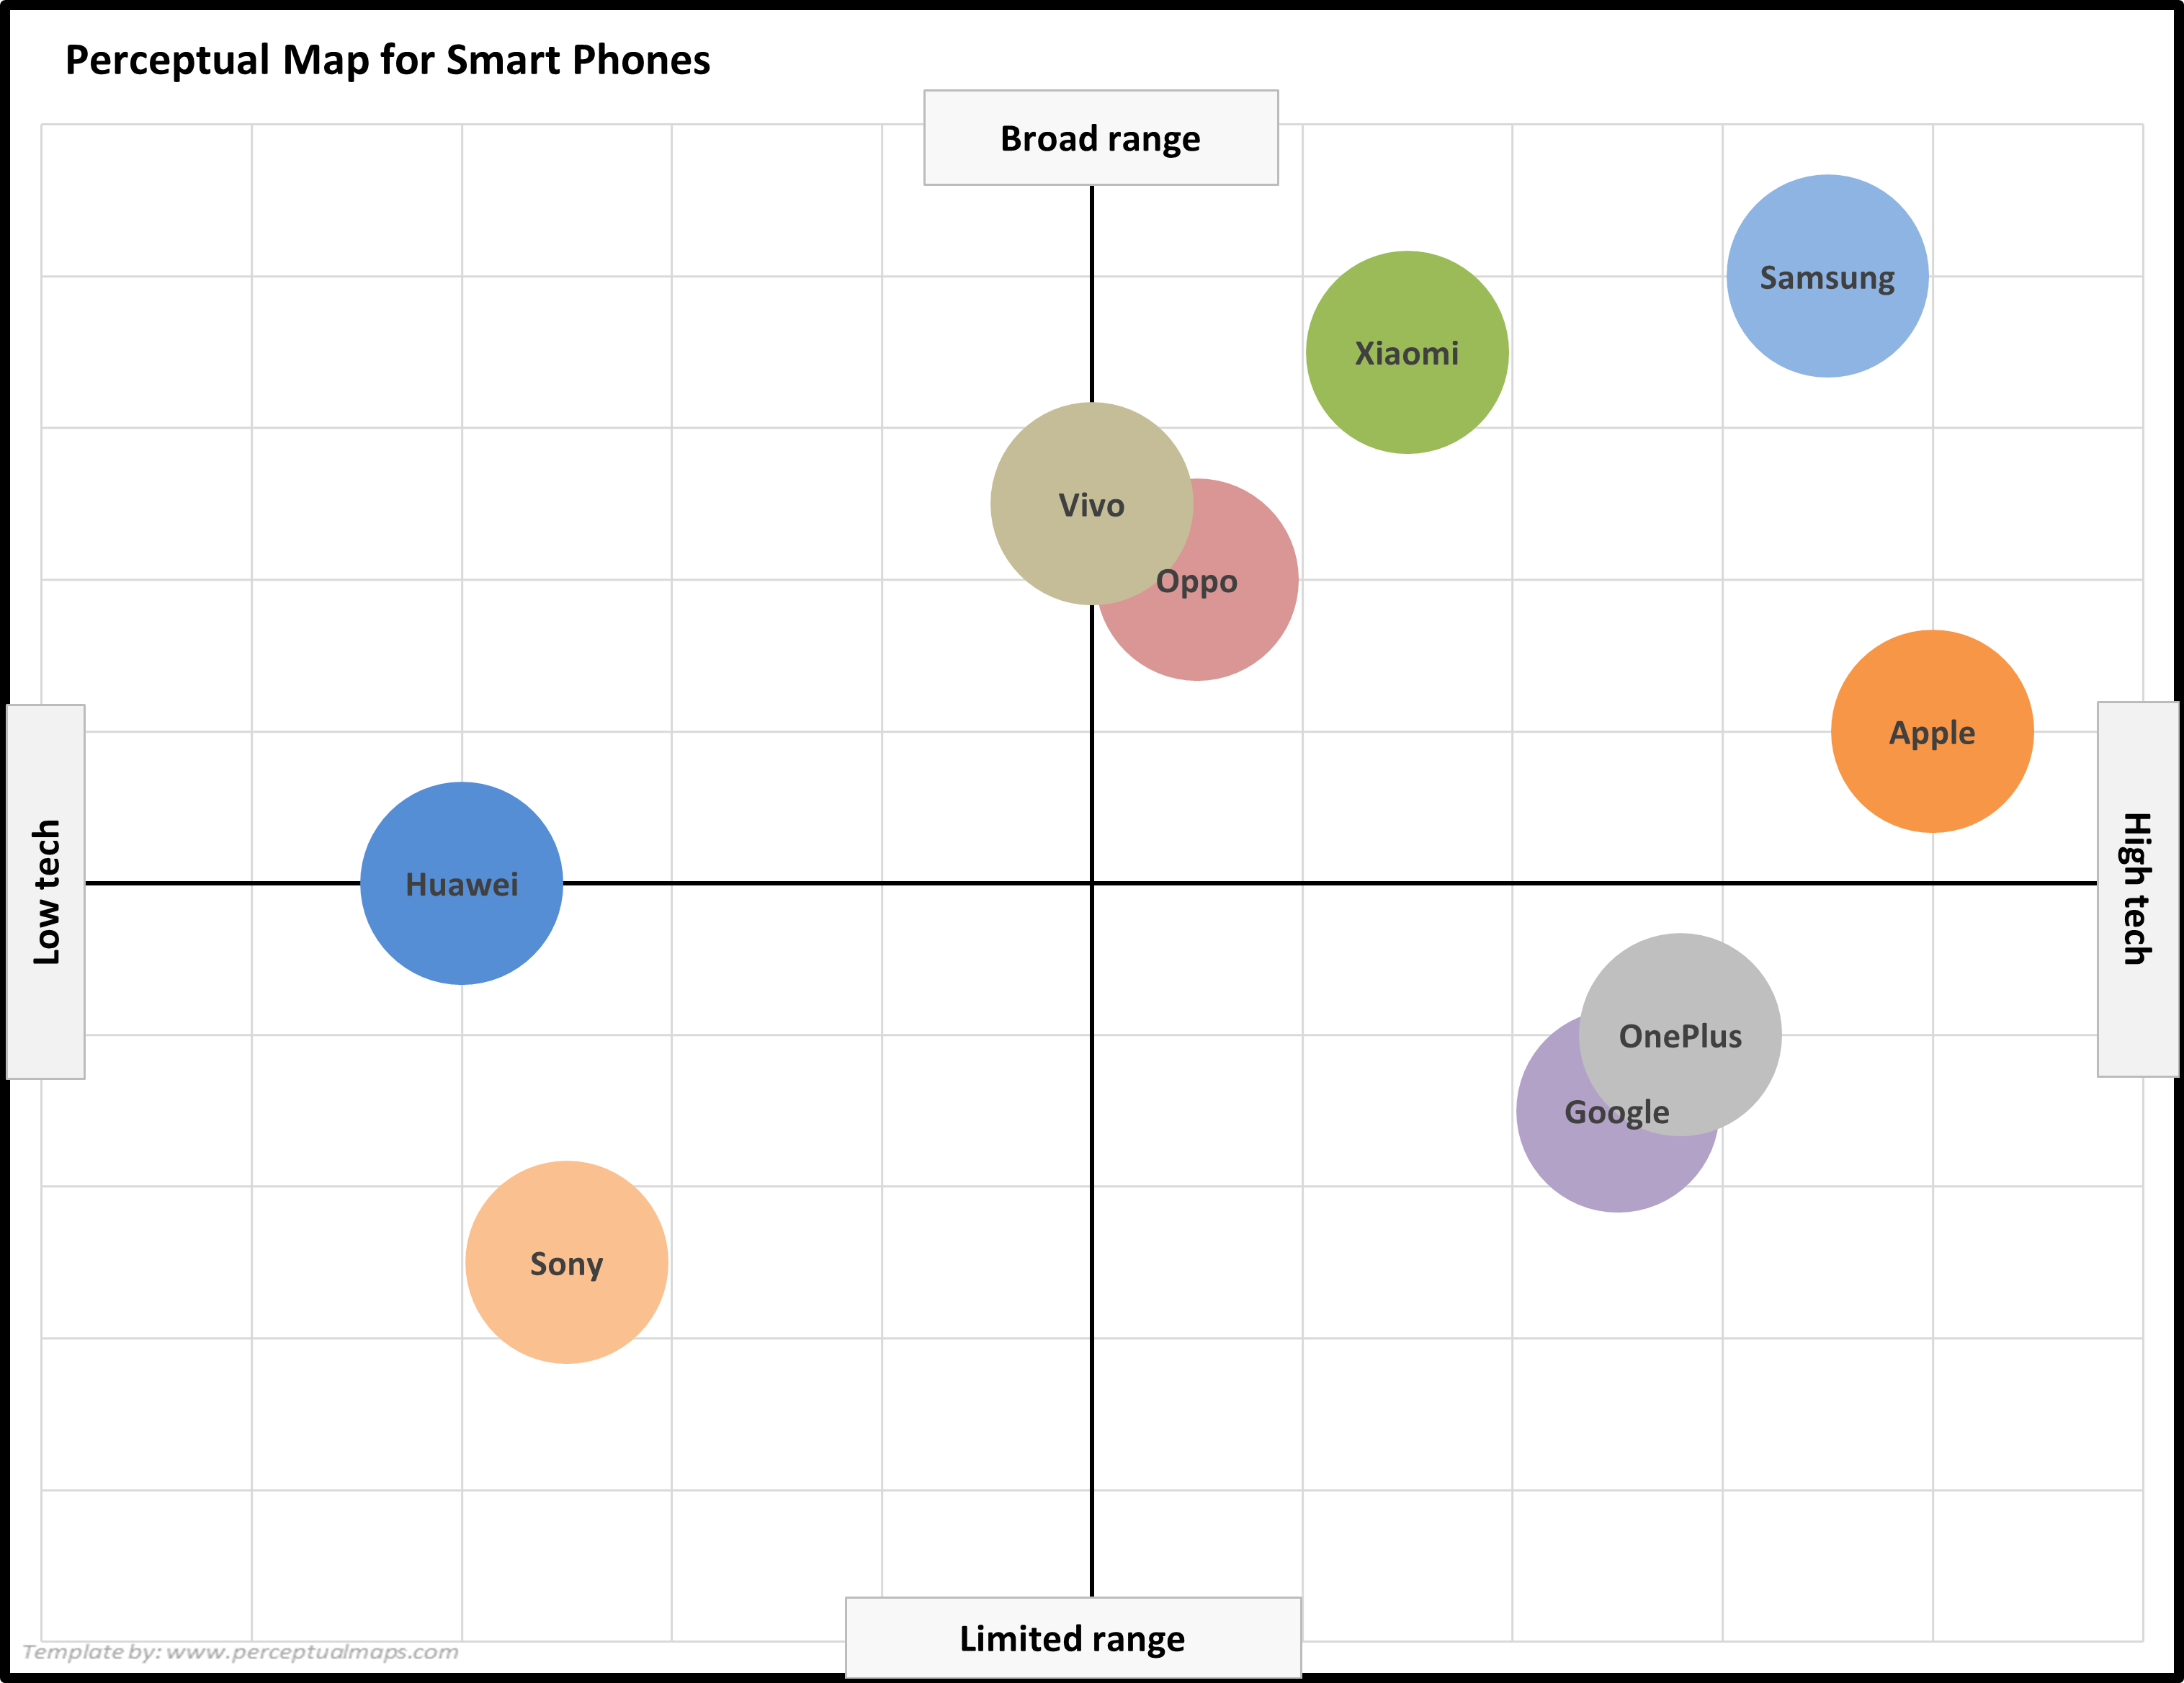
EXAMPLE Perceptual Maps for Smart Phone (and Cell) Phones
In this set of example perceptual maps, the major smart brands in the USA market have been mapped.
As you can see the most of major brands are presented, across multiple different product attributes. You should note how the competitors have a different positioning as new attributes are introduced in each map.
For further detail, please review:
This perceptual map of smart phone brands uses the attributes of broad/limited range and high/low tech.


EXAMPLE Using a Perceptual Map to Own Part of the Market
There are two approaches to successfully owning part of the market. The first, and most commonly discussed, is to target a gap in the market.
In this case, the firm simply introduces a product offering that is not provided by competitors.
The second approach (second map below) is used by larger brands looking to push a competitor out of the market space.
These approaches are discussed further in the positioning strategy section, and also in: Five Ways to Reposition a Brand.
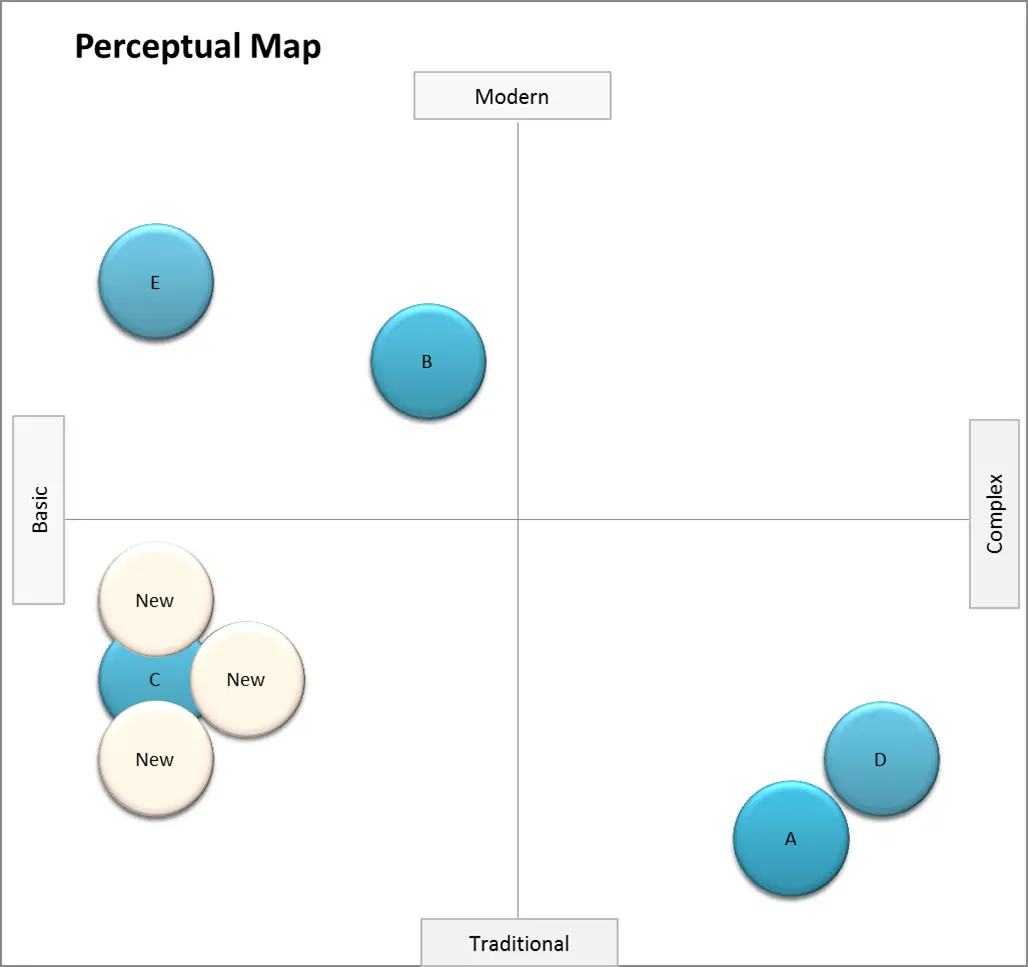
Example of crowding a competitor with multiple brands
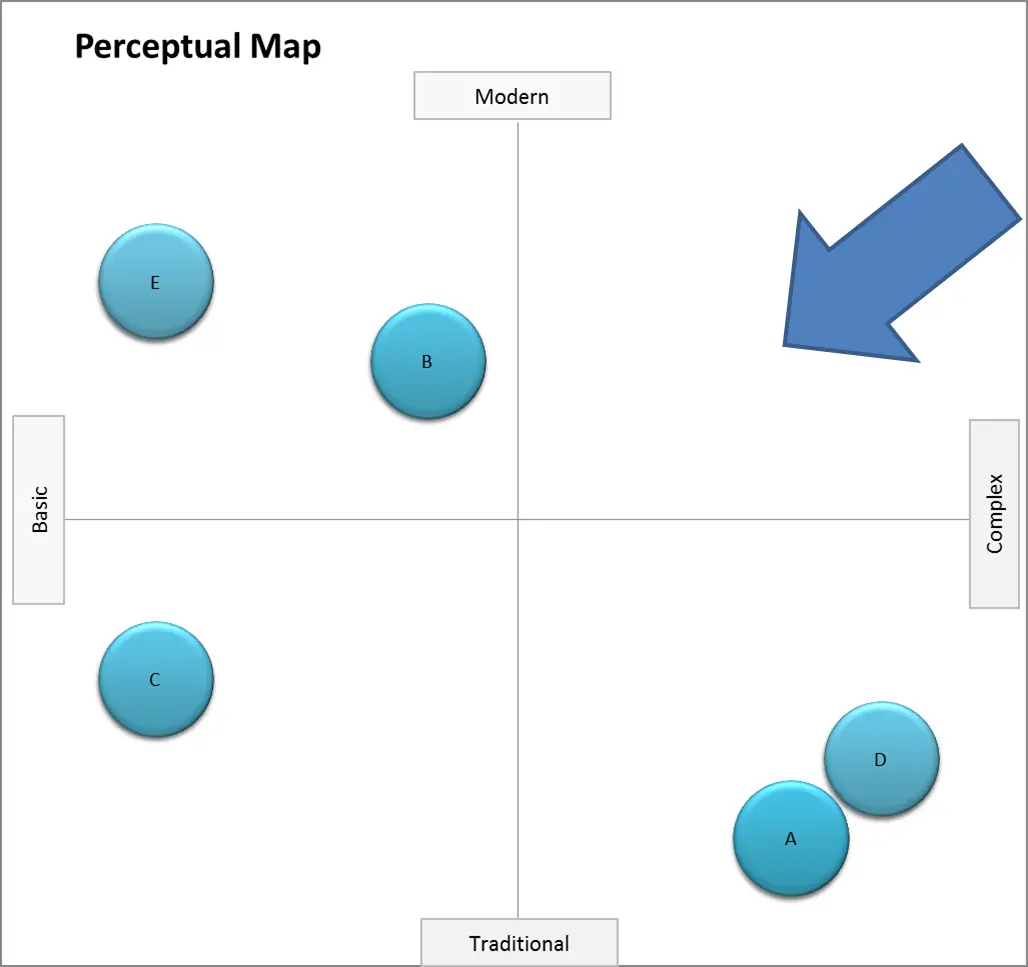
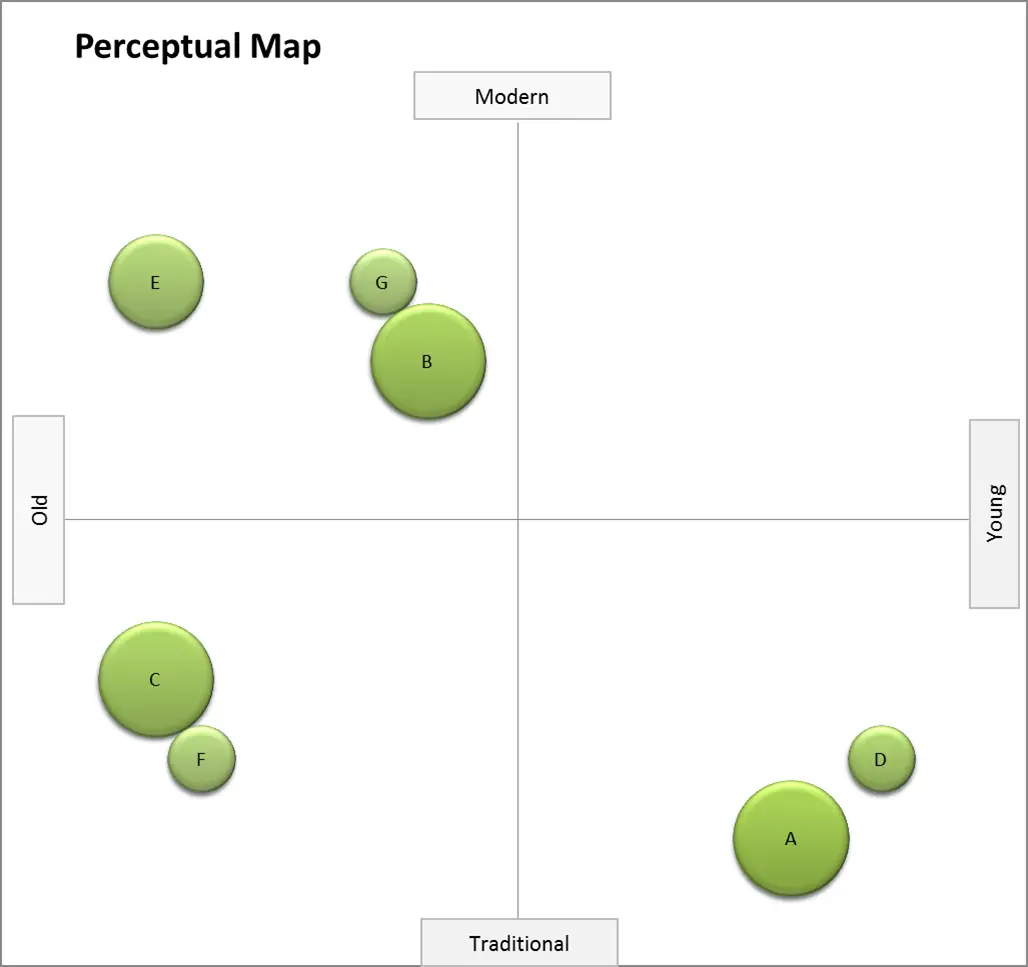
EXAMPLE Perceptual Map Highlighting Me-too Positioning
One of the strategic options for positioning, especially for smaller brands, is to adopt a me-too positioning. This is discussed further in the positioning strategy section, but it is a deliberate strategy designed to associate the smaller brand with the strong brand equity and perceived benefits of the larger brand.
Related Information
- List of Axis Attribute Ideas for Perceptual Maps
- Perceptual Maps: Best Practice
- Top 12 Tips for Analyzing Perceptual Maps
- Using Perceptual Maps to Understand Competitive Sets
- Get the Most Out of Your Perceptual Maps
For further information on positioning and perceptual maps, you should also visit the: