Example Perceptual Maps for Smart Phones
Below you will find two different example perceptual maps for Smart Phones.
Two variations of perceptual maps have been provided below (using different product and/or brand attributes), in order to give you a choice of the map that best suits your needs.
You should note that each mapping approach will “paint a different picture” of the market, which may help provide insight into the relative brand positioning strategies.
IMPORTANT NOTE: These example maps have been provided for educational purposes only and are estimates of brand positioning only, and should not be relied upon for decision-making. Perceptual maps used in marketing should always be based upon current and valid consumer image data.
Design Notes
Each of the example perceptual maps below have been created with the Excel perceptual map maker/template available for free download on Perceptual Maps 4 Marketing.
You can use this Excel perceptual map template in conjunction with the product/brand attribute ideas to design your own perceptual map (if required). Please refer to the list of tools and resources at the end of this post.
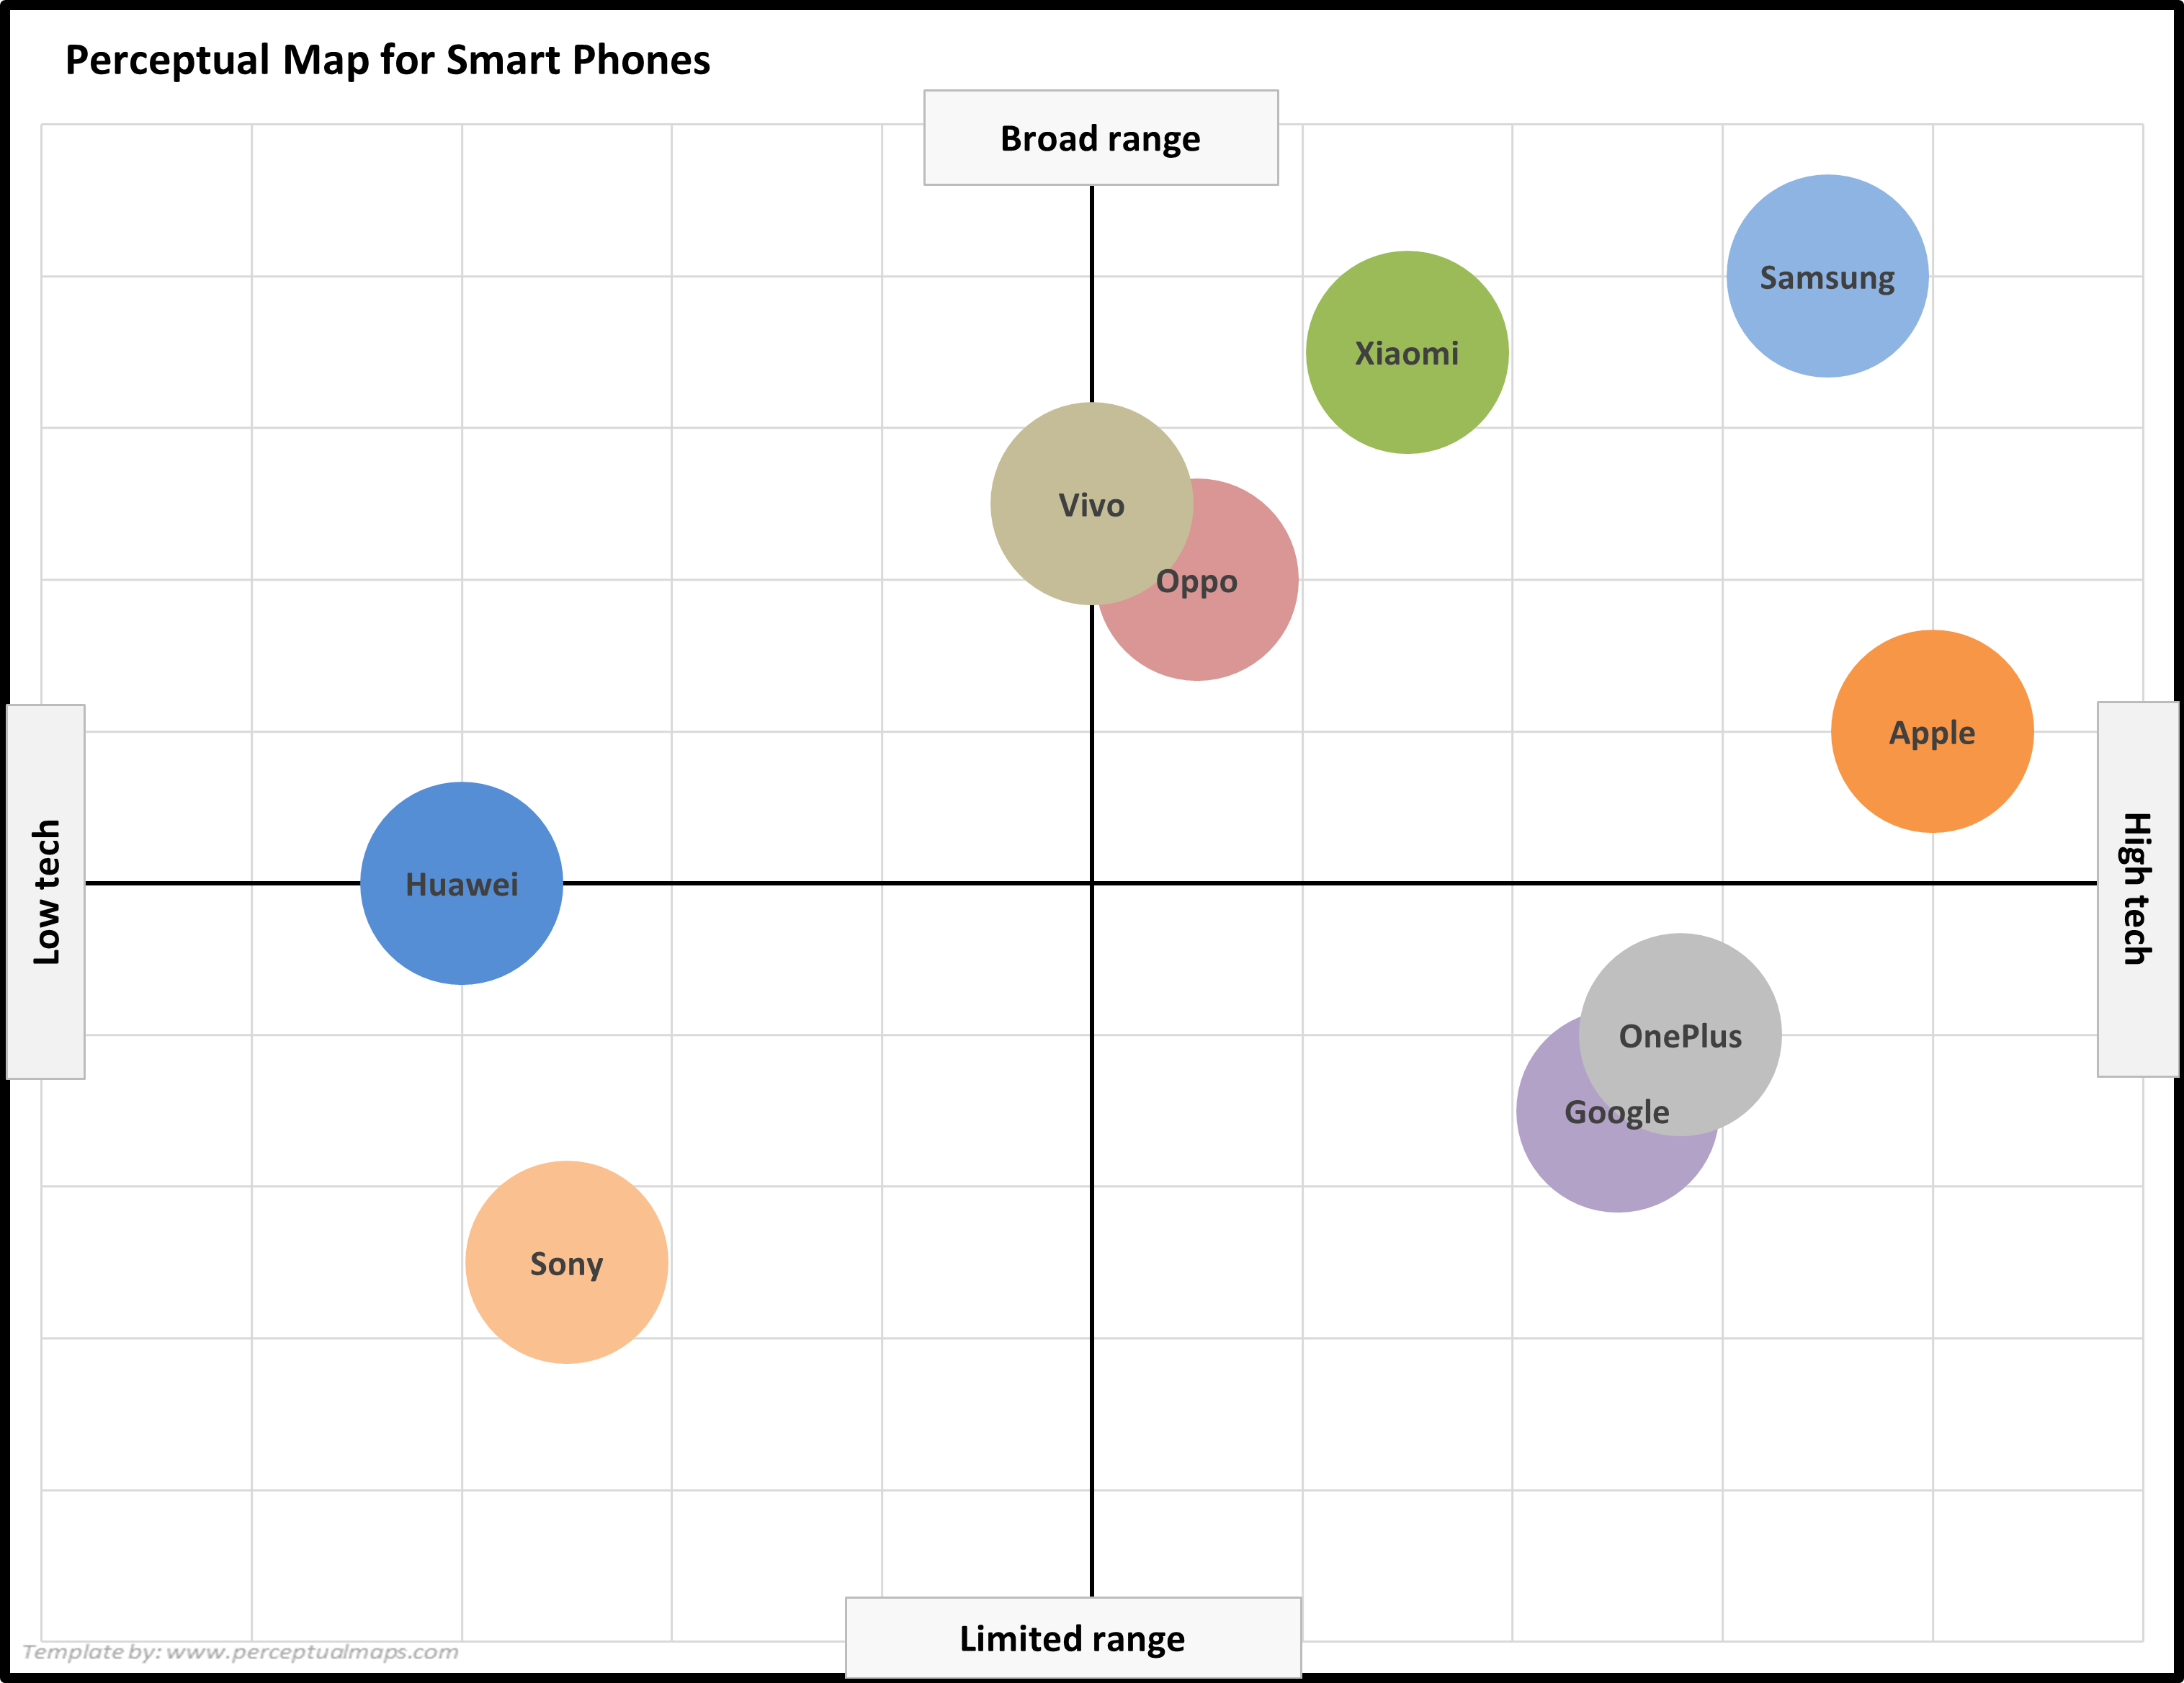
1st Example Perceptual Map for Smart Phones
Want to design your own map? Take me to the free download page: Free Download of the Perceptual Map Template
Perceptual Map Scores Rationale and Discussion
For the product/brand attributes of: Low tech to high tech
– Apple: 9 (Innovative design, advanced hardware and software integration, and strong brand reputation for cutting-edge technology)
– Samsung: 8.5 (High-quality hardware, innovative features, and a wide range of devices catering to different markets)
– Google: 7.5 (Strong software capabilities, integration with Google services, and focus on AI-driven features)
– Huawei: 2 (Limited access to Google services and recent US government restrictions have hurt its high-tech image)
– Xiaomi: 6.5 (Affordable devices with competitive specs, but not always perceived as cutting-edge)
– Oppo: 5.5 (Mid-range devices with some innovative features, but not widely recognized as a high-tech leader)
– Vivo: 5 (Affordable devices with decent specs, but lacking strong brand reputation for high-tech innovation)
– OnePlus: 7.8 (Strong focus on high-quality hardware and performance, but limited market penetration compared to Apple and Samsung)
– Sony: 2.5 (Once a leader in mobile technology, but has fallen behind competitors in recent years)
Note: These are hypothetical ratings developed with the assistance of AI tools.
For the product/brand attributes of: Limited range to broad range
– Apple: 6 (Offers a limited but well-curated range of devices, focusing on quality over quantity)
– Samsung: 9 (Broad range of devices, from budget to flagship, catering to various consumer segments)
– Google: 3.5 (Limited range of Pixel devices, primarily focused on showcasing Google’s software capabilities)
– Huawei: 5 (Offers a range of devices, but recent restrictions have limited its product offerings, especially in the US)
– Xiaomi: 8.5 (Broad range of devices, from budget to premium, appealing to a wide range of consumers)
– Oppo: 7 (Diverse product lineup, including mid-range and flagship devices)
– Vivo: 7.5 (Wide range of smartphones, catering to various price segments and consumer preferences)
– OnePlus: 4 (Limited range of devices, focusing on high-quality hardware and performance)
– Sony: 2.5 (Narrow range of devices, with a focus on specific niches like gaming and photography)
Note: These are hypothetical ratings developed with the assistance of AI tools.
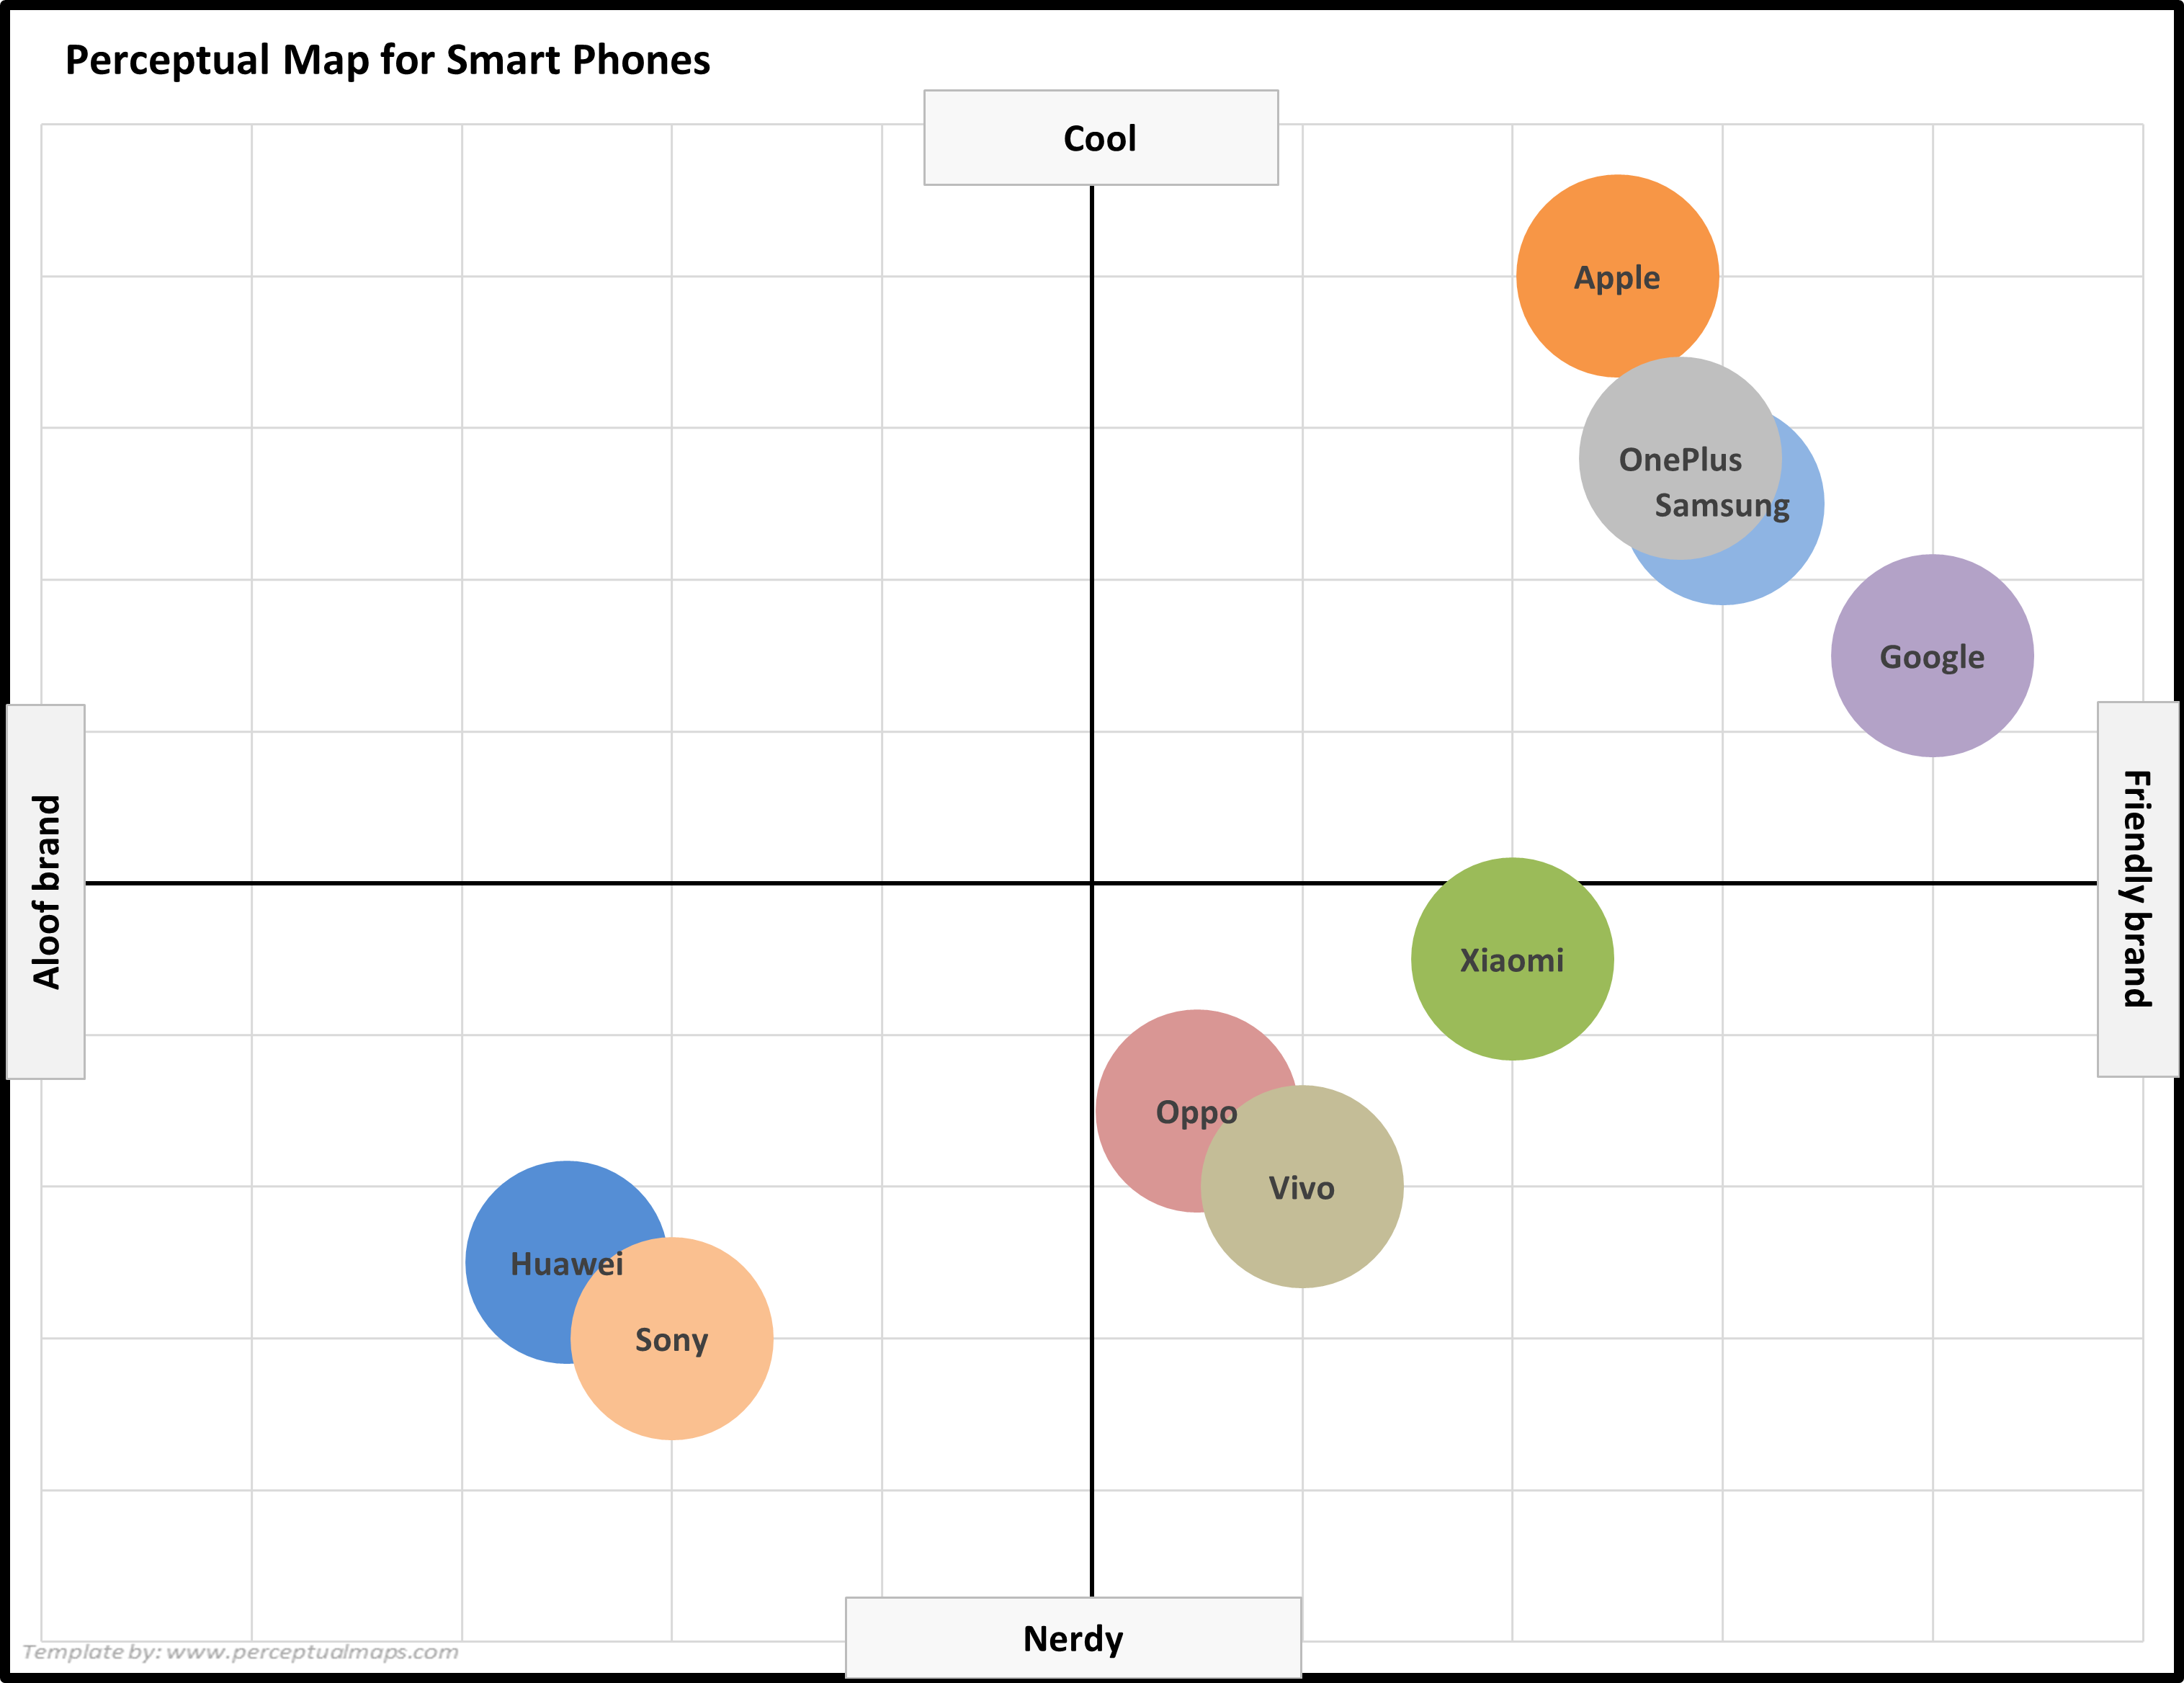
2nd Example Perceptual Map for Smart Phones
Want to design your own map? Take me to the free download page: Free Download of the Perceptual Map Template
Perceptual Map Scores Rationale and Discussion
For the product/brand attributes of: Nerdy to cool
– Apple: 9 (Sleek design, strong brand identity, and cultural appeal make it a “cool” choice for many consumers)
– Samsung: 7.5 (Wide range of stylish devices and innovative features, but not quite as “cool” as Apple)
– Google: 6.5 (Strong software capabilities, but hardware design is seen as more functional than fashionable)
– Huawei: 2.5 (Recent controversies and limited access to Google services have hurt its “cool” factor)
– Xiaomi: 4.5 (Competitive specs and affordability, but lacking the strong brand identity of more “cool” brands)
– Oppo: 3.5 (Innovative features, but not as widely known or recognized as a “cool” brand)
– Vivo: 3 (Affordable devices, but brand perception is more budget-oriented than “cool”)
– OnePlus: 7.8 (High-quality hardware and performance with a dedicated fan base, seen as a “cool” alternative to Apple and Samsung)
– Sony: 2 (Once a leader in mobile technology, but has lost its “cool” factor due to falling behind competitors)
Note: These are hypothetical ratings developed with the assistance of AI tools.
For the product/brand attributes of: Aloof brand to friendly brand
– Apple: 7.5 (Strong brand identity and retail presence, but some consumers may perceive it as exclusive or elitist)
– Samsung: 8 (Wide range of devices and price points, catering to various consumer segments, and strong customer support)
– Google: 9 (Friendly brand image, known for its user-focused software and strong customer support)
– Huawei: 2.5 (Recent controversies and limited access to Google services have hurt its brand image, making it less approachable)
– Xiaomi: 7 (Offers competitive specs and affordability, making it a friendly choice for many consumers, but not as well-known as other brands)
– Oppo: 5.5 (Gaining recognition for its innovative features, but still not as widely recognized as a friendly brand)
– Vivo: 6 (Offers affordable devices, making it a friendly option for budget-conscious consumers, but not as well-known as other brands)
– OnePlus: 7.8 (Strong focus on high-quality hardware and performance, with a dedicated fan base and friendly online community)
– Sony: 3 (Once a leader in mobile technology, but has become more aloof as it has fallen behind competitors)
Note: These are hypothetical ratings developed with the assistance of AI tools.
More Perceptual Mapping Information and Resources
Reasons to Use Perceptual Mapping
List of Product and Brand Attributes Ideas
Working with Perceptual Maps
- Perceptual Maps: Best Practice
- Get the Most Out of Your Perceptual Maps
- Top 12 Tips for Analyzing Perceptual Maps
Other Perceptual Mapping Tools
- Make 100s of Perceptual Maps Really Fast
- When to Use an Overall Similarities (OS) Perceptual Map
- What are Joint Space Maps?
- What is a Multi-Dimensional Scaling (MDS) Perceptual Map?
- How to Make a Perceptual Map in Excel 365
- How to make a perceptual map in PowerPoint
- Different Types of Perceptual Maps
Perceptual Maps 4 Marketing
- The Home of the Free Perceptual Map Excel Template
- Downloaded over 100,000 times since 2013
- Always free, always will be
- Ideal tool for marketing students, analysts, and practitioners
Take me to the free download page: Free Download of the Perceptual Map Template