Contents
Introducing Multi-Dimensional (MDS) Perceptual Maps
Introduction
This article explains the difference between a two-axis (or two-attribute) perceptual map which you have probably seen before and what is known as a multi-dimension scaled perceptual map, sometimes called MDS for short.
As you will see, multi-dimension scaled maps are a significant increase in analytical power and insight for your marketplace. They should be used in conjunction with the usual two-attribute perceptual map, rather than in isolation.
Looking for a free MDS mapping Excel template?
- Click on this link to download the free multi perceptual map template
Please review the following summary video, or scroll down for the full article…
Quick Recap of Two-Dimensional Perceptual Maps
If you’ve studied marketing or been involved in marketing for some time, no doubt you’ve come across the standard two-axis perceptual map. It’s commonly presented on the internet and is in most marketing textbooks.
You might almost be forgiven for getting the impression it’s the only version or variation of a perceptual map you can have, but that’s not the case – there are a number of Different Types of Perceptual Maps.
As a reminder of the basic map, we look at two brand attributes only. These are usually image attributes or product features or something relevant to the consumer when they’re buying in that product category.
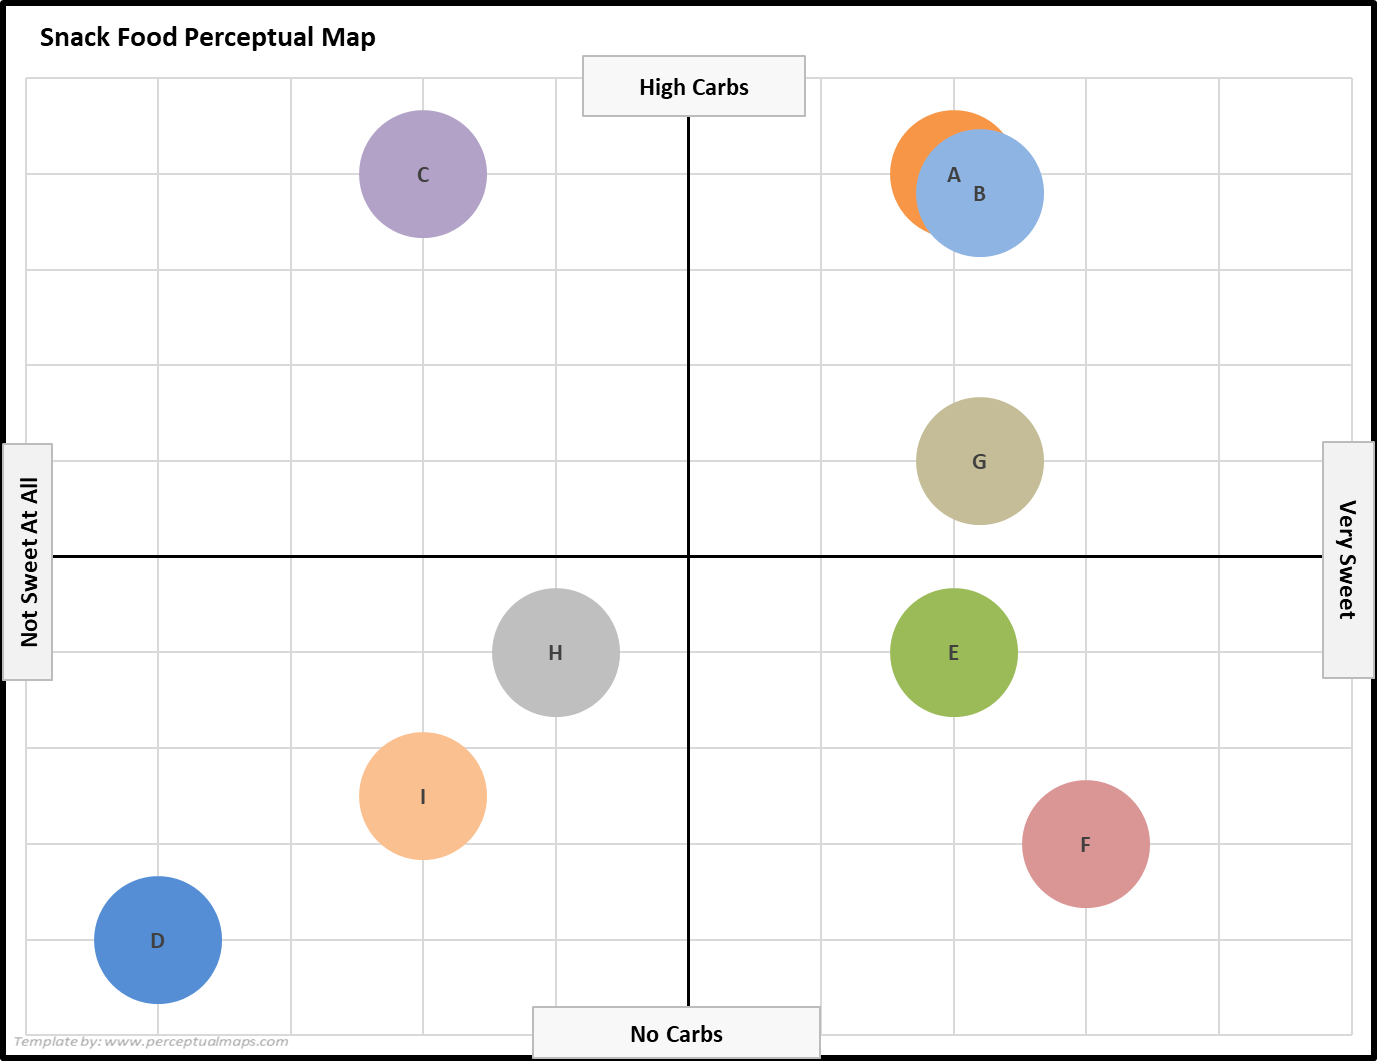
Here is an example of a perceptual for the snack food market…
We’re trying to find attributes that help explain positioning and help explain the differentiation between the brands.
As you can see, the attribute examples used in this map are:
- Very Sweet to Not Sweet At All
- High in Carbs to No Carbs
You should note that each attribute is expressed as an opposite. The purpose of this is to ensure that we map a good spread of brand positions.
The brand positioning data is ideally obtained from a consumer survey where we would ask something like:
- On a scale of 1 to 7, with 1 being very sweet and 7 not sweet at all, how would you rate Brand X?
Then we would go through and ask them about all the brands that we’re interested in, and we get an average score across the respondents.
If we look at the above map, we can see that Brand C has been rated high on carb, and relatively low on sweetness.
After our recap, let’s now turn to why we would also MDS perceptual maps.
Limitations of Two-Dimensional Maps
We will also look to use MDS maps because the standard two-attribute perceptual map has the disadvantage of mapping just two attributes at a time.
And while that’s fine for mapping low involvement products (simple products) where consumers are choosing between products based on a single attribute. But for many products, consumers will take the sum of product attributes into consideration when they’re making their purchase decision.
That’s where MDS maps come in. As mentioned above, multi means more than two. And MDS maps allow us to see a bigger picture of the market at the one time – which comes in very handy from a analytical perceptive.
And as also mentioned above, we should use both types of maps at the same time. They’re not mutually exclusive, and I would encourage you, if you’ve got the data to work with, to actually produce multiple two-dimensional perceptual maps and also run and analyze MDS maps.
Introducing Multi-Dimensional Scaled (MDS) Maps
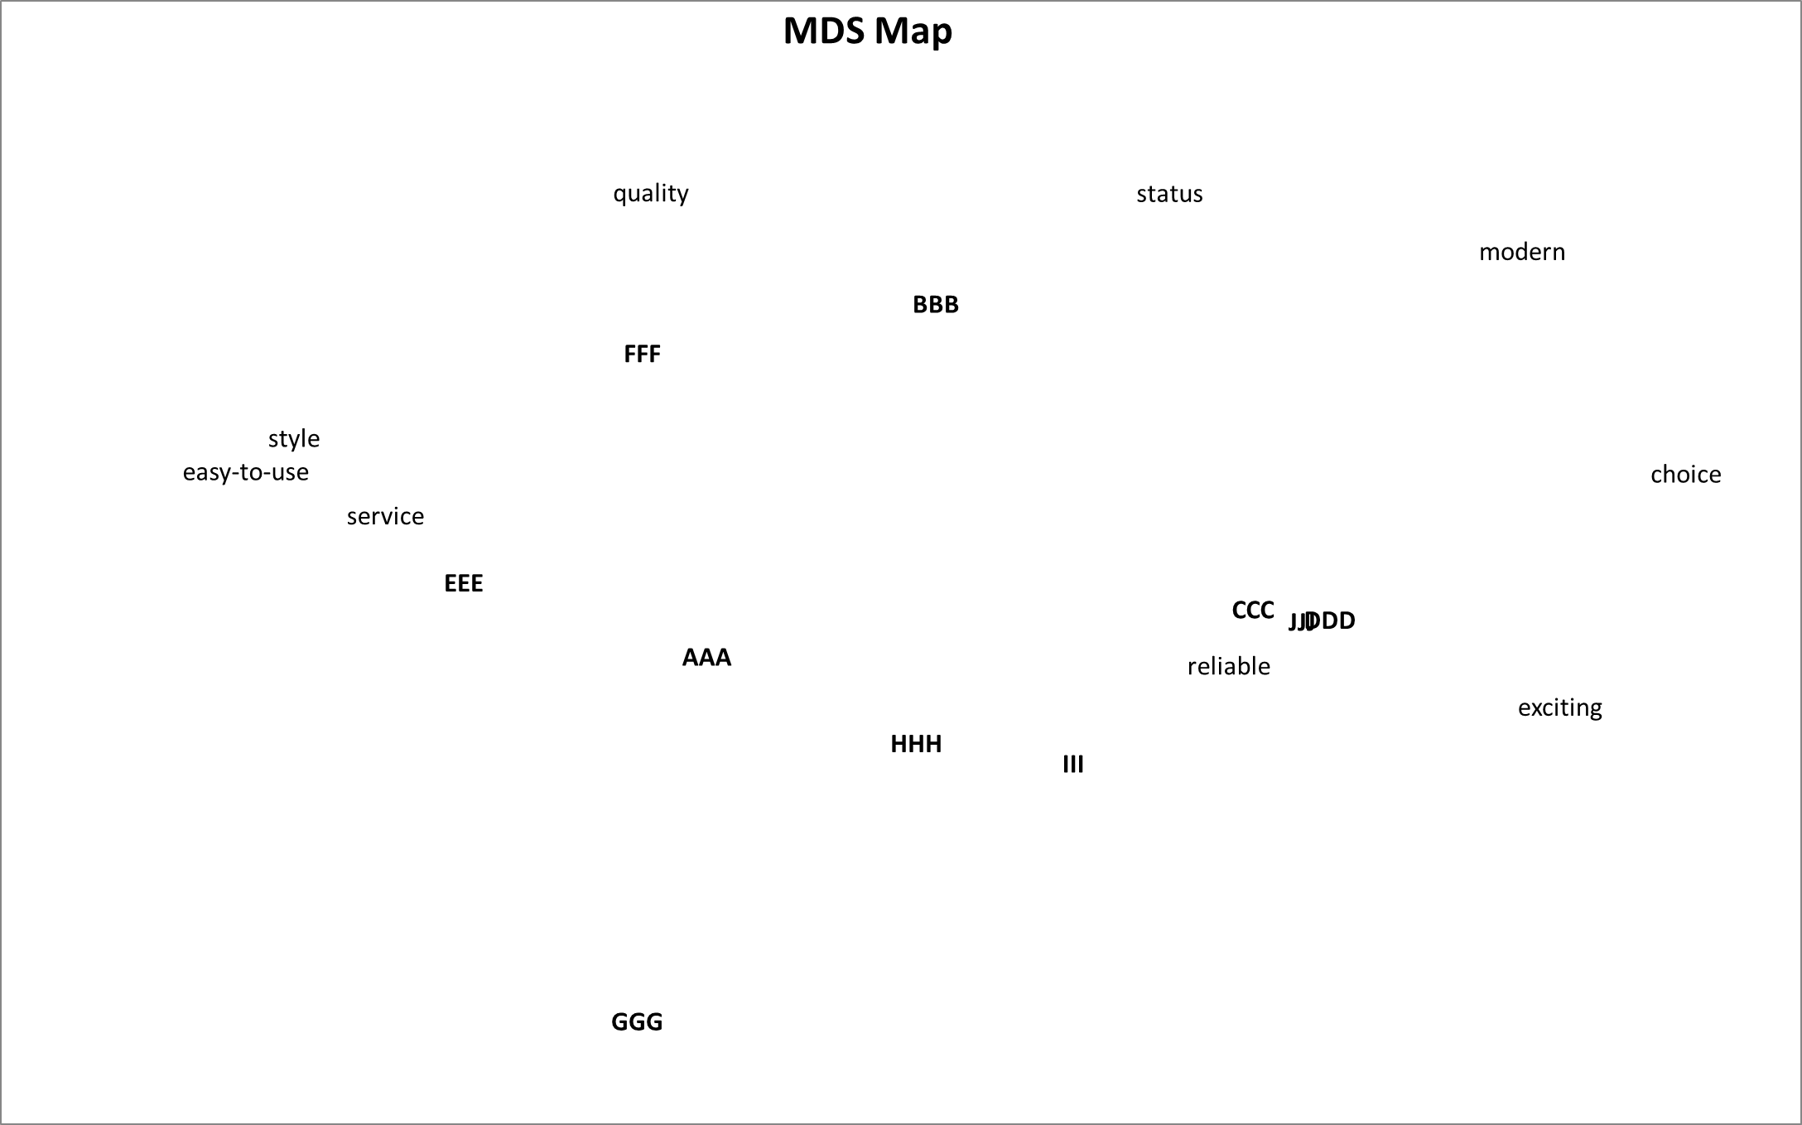
Probably the best way to introduce MDS maps is to show you one. As we can see, the brands are in letters (AAA to JJJ) and the attributes are shown as well. You should note that there 10 attributes shown on the same map – giving a picture of the overall market.
Now let’s take a closer look.
No Axes on the Map
Firstly, you should note that there are no axes on this map. There is NO guidance that tells how/why the brands are positioned in this fashion in the consumer’s minds.
Identifying (or uncovering) how/why the brands fall this way (relative to the attributes) is the role of the marketing analyst. They will need to logically connect the possible in-market relationships and draw in the underlying market dimensions.
For more information on this analysis process, please see: How to interpret a multi-attribute perceptual map
It’s Like a Normal Map
The best way to read a MDS map is to think of it like a map that you would have in an atlas or on Google Maps. Are the points close together or far apart?
Points close together – whether they are brands or product attributes – are interrelated in the perceptions of the consumers. And points far apart are perceived as opposite or quite distinct.
This concept applies for BOTH brands and product attributes. For example, in the above map, consumers perceive exciting and quality as quite different to each other, and they see style and easy-to-use as very similar attributes.
This “real map” structure allows us to see attributes that are considered similar and dissimilar, and we can see brands that are positioned close together and brands that are seen as quite distinctive in the consumer’s mind.
Suggested Reading
- About Multidimensional Perceptual Maps
- Video Guide to Multi-dimensional Scaled (MDS) Perceptual Maps
- MDS Maps vs Correspondence Analysis Maps
- Premium MDS Mapping Template
- How to Make a MDS Map from Start to Finish (VIDEO)
- Different Types of Perceptual Maps
Quick MDS Maps FAQ Recap
What is a multi-dimension scaled (MDS) perceptual map?
A multi-dimension scaled perceptual map is a more advanced version of a standard two-axis perceptual map, allowing marketers and analysts to visualize the positioning and differentiation of brands based on multiple attributes at the same time.
How does an MDS perceptual map differ from a two-dimensional perceptual map?
A two-dimensional perceptual map plots brands based on two attributes, while an MDS perceptual map incorporates multiple attributes, giving a more complete picture of the market. MDS maps do not have axes, and the interpretation of the relationships between brands and attributes is left to the marketing analyst.
Can MDS perceptual maps and two-dimensional perceptual maps be used together?
Yes, MDS perceptual maps should be used in conjunction with two-dimensional perceptual maps for a more comprehensive analysis of the market. Both types of maps can provide valuable insights into brand positioning, differentiation, and consumer perceptions.
How are the brand positions determined on an MDS perceptual map?
Brand positions on an MDS perceptual map are determined using consumer survey data. Respondents are asked to rate each brand based on various attributes, such as sweetness or carb content, on a given scale. The average scores across respondents are then used to plot the brands on the map.
How should I interpret an MDS perceptual map?
To interpret an MDS perceptual map, think of it like a regular map. Points close together, whether they are brands or product attributes, are perceived as interrelated by consumers, while points far apart are perceived as distinct or opposite.
It is the marketing analyst’s role to identify the underlying market dimensions and draw logical connections between the brands and attributes.
What are the limitations of a two-dimensional perceptual map?
A two-dimensional perceptual map is limited by its ability to represent only two attributes at a time. This can be suitable for mapping simple, low-involvement products where consumers make choices based on a single attribute.
However, for products where consumers take multiple attributes into consideration, a multi-dimensional scaled perceptual map is more appropriate.
For more information, please review: Limitations of Perceptual Maps
Are there any other types of perceptual maps?
Yes, there are several different types of perceptual maps. The two-axis perceptual map and the MDS perceptual map are just two examples.
Depending on the goals of your market analysis and the data available, you may choose to use other types of perceptual maps to gain insights into your market.
Please refer to: Different Types of Perceptual Maps
As well as: MDS Maps vs Correspondence Analysis Maps