Wait, what? There’s more than one type of perceptual map? Yes! Lets’ find out about the five main different types of perceptual maps to improve your brand positioning and marketing analysis.
Contents
The Main Types of Perceptual Maps
There are five perceptual map tools that will be discussed in this article, namely:
- Standard two-dimensional (two attribute) perceptual maps
- Positioning maps
- Multi-dimensional scaled (MDS) perceptual maps
- Perceptual mapping using correspondence analysis
- Overall perceptual similarity maps
Please review the video for scroll down for the complete article….
Standard two-dimensional (two attribute) Perceptual Maps
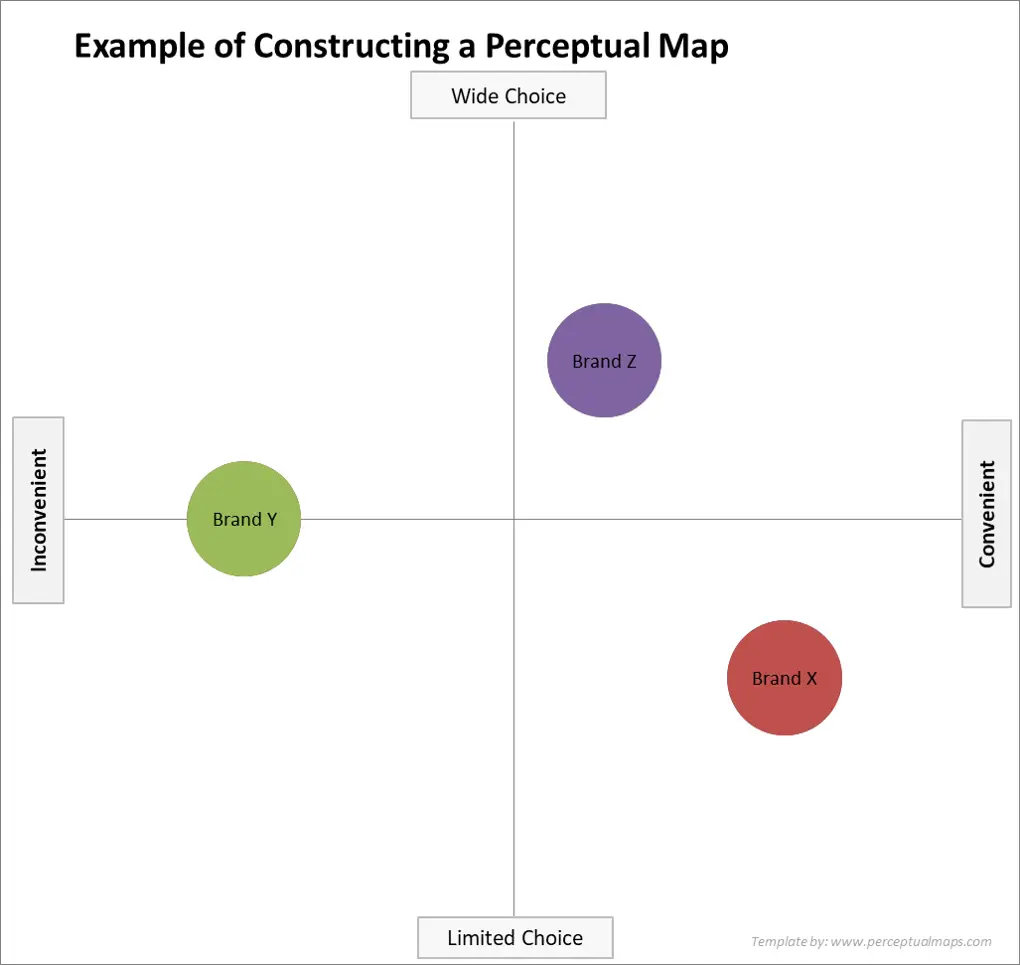
I would imagine that most marketers are familiar with the standard two-dimensional perceptual map that is constructed using two brand or product attributes placed on a scatter chart, as per the example below.
This type of perceptual map is relatively simplistic in its design, which makes it an excellent visual representation tool for presenting competitive brand positioning.
I am also keen to promote this type of perceptual mapping as a powerful analytical tool, provided that multiple maps are run and analyzed together.
Perceptual maps – as you can tell by the name are designed to map “consumer perceptions” of the competing brands (and/or products) in a marketplace. This means that these maps need to be constructed from real consumer data.
If we rely on consumer data, then the maps show the positioning of the brand in the minds of the consumers = we are mapping the perception of brand positioning. This is ideal, because we want to know how the consumers think and understand our brands = a key component of brand positioning success.
Please remember that we would run multiples of these maps and look at variations of different maps at different levels, different segments, different competitors, different attributes, and that will allow us to analyze the market, hopefully gain some insights.
To help you with this analytical task, please check out:
- Free Download of the Perceptual Map Template
- Make 100’s of Perceptual Maps Really Fast
- Get the Most Out of Your Perceptual Maps
Positioning Maps
Whenever we do not have consumer data and we are just plotting it from a strategic viewpoint and the marketing team is constructing the map based upon their opinions or their plans for the brand, then we call that a positioning map.
It is called a positioning map because it does NOT map any consumer perceptions. Typically, positioning maps are a strategic tool used to map out the future of the brand positioning.
Perceptual maps are used to show the consumer’s viewpoint, whereas positioning maps are used to show the future brand positioning strategy and goals.
From there, our marketing plans would be executed in order to maintain or reposition the brand’s perception in the minds of consumers. That means, that we may use both perceptual and positioning maps together.
To find out more, please see this article on Difference between a Perceptual Map and a Positioning Map
Multi-dimensional Scaled (MDS) Perceptual Maps
Let’s now look at multi-dimensional scaling maps (or MDS). Here is an example of an MDS map:
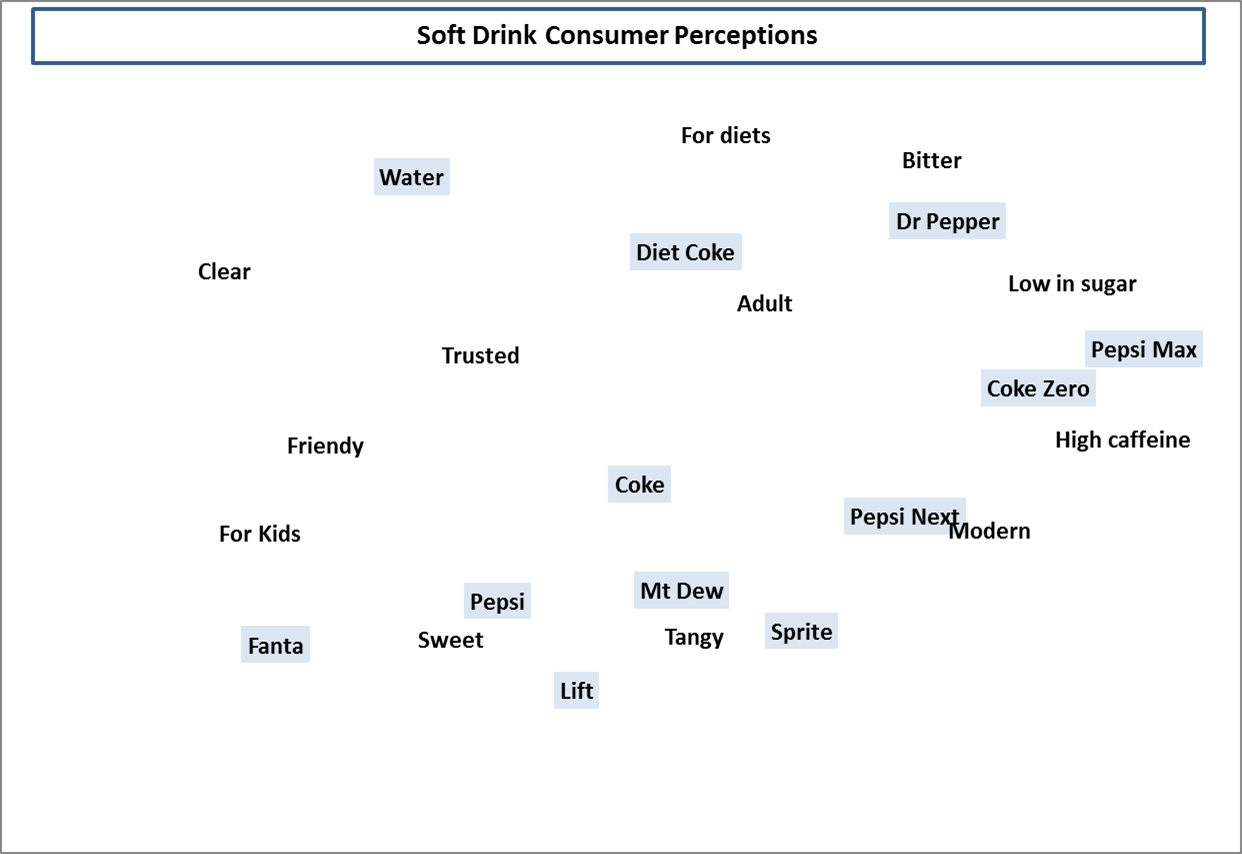
What you notice here is that instead of mapping just two attributes, we map all attributes at once. In the case of this type of perceptual map, ALL = MULTI.
That means that we’re looking at multi-dimensions (that is, multiple brand and product attributes at the one time) = hence the name of the map. For this above example, we’re combining the attributes of “sweet, friendly, modern, tangy, etc.” all onto the SAME perceptual map.
As we have all the attributes and all the brand in the one map, we are painting a picture of how consumers see the overall market.
This is different to the standard two-attribute perceptual map, where only two dimensions are considered. The reality is this is NOT reality in the marketplace. In most cases, especially higher-involvement purchases, a consumer is unlikely to be considering two attributes only in their purchase decision.
That’s where multi-dimension scaling comes into play – as we were able to map multiple attributes at the same time. This gives us a better insight into how consumers see the overall market.
And you should also notice that there’s no axes on map. It’s just blank and the map could be rotated in any direction. Think of it like a geographic map that you would have online (or in the old days in an atlas). The ones that are far apart are not really competing, as they are perceived to be quite different. And the closer the brand is to a particular attribute, then the stronger the association with it.
However, this is not as simple as it appears, and a trained marketing analyst is required to effectively interpret these kind of perceptual maps. If analyzed correctly these MSD maps can be effective for identifying:
- direct and indirect competitors,
- the interrelationships between attributes,
- the attributes owned by specific brands, and the attributes shared by brands,
- and the extent of brand distinctiveness in the minds of consumers
For more information on MDS maps please see the article on Multi-Attribute Perceptual Maps.
Plus check out the free and premium MDS templates available on Perceptual Maps for Marketing:
Perceptual Mapping Using Correspondence Analysis
You may have seen correspondence analysis map if you’ve been using a professional marketing research company. Here is an example of a correspondence analysis perceptual map.
As we can see there are two dimensions running vertically and horizontally – each with numbers – plus scattered around the map there are multiple brands (as indicated by the letters) and multiple brand and product attributes.
At first glance, this map appears to be similar to the multi-dimension scale maps that we just discussed, BUT they are interpreted very differently. Again, we are more likely to be relied upon any professional marketing analyst to help interpret these maps.
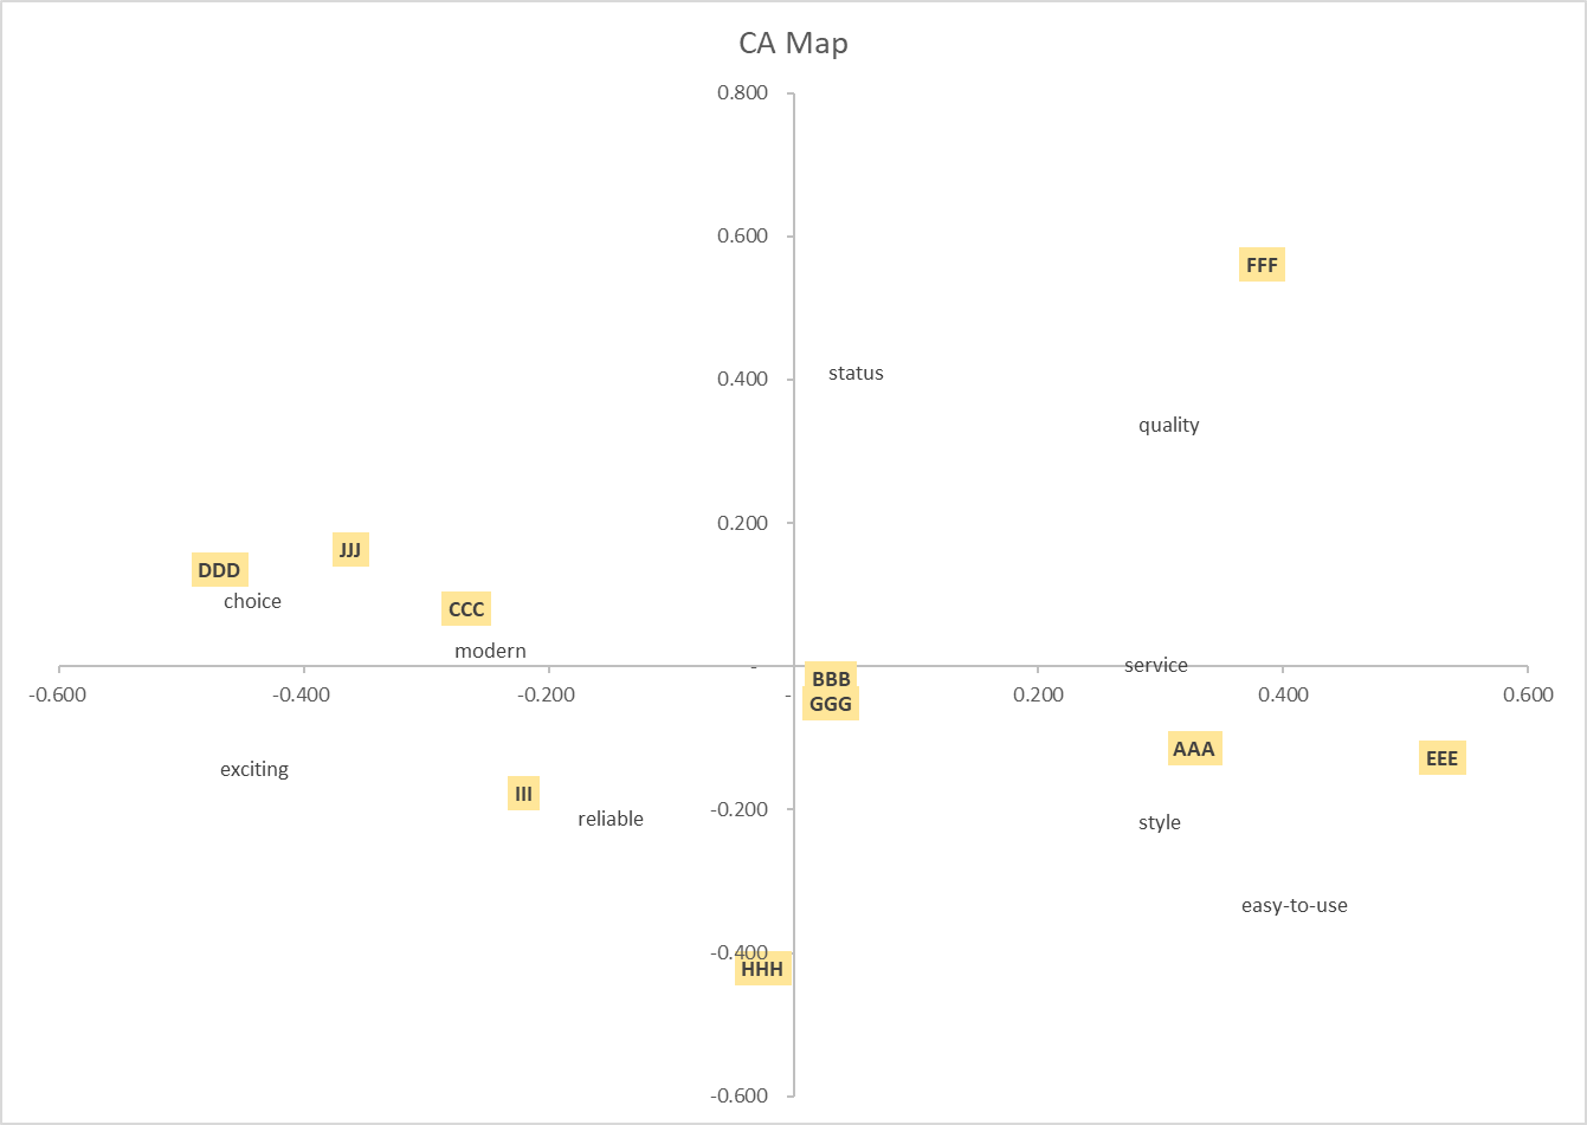
The easiest way to discuss the analysis of these maps (using correspondence analysis), is to think of them as distinctiveness maps. The closer the brand is to the center of the map – in this case BBB and GGG the LESS distinctive the brands are.
Brands located well away from the center of the map – such as DDD – means that the brand is quite distinctive and different to the “average” brand in the market.
We then draw a line from the center (the intersection of the two axes) to the brand and product/brand attributes along the way the attributes that the brand is most closely related to an associated with.
For example, brand DDD on this perceptual would be most closely related to choice and modern. Even though it is some distance from “modern” the line that we would have drawn (as above) would pass through modern and connect that positive brand attribute to our brand.
For more information on correspondence analysis maps, please see my article and video on the difference between multi-dimensions scaling maps and correspondence analysis perceptual maps below:
Please note that you usually need a software package to produce these correspondence analysis maps. They can be done on Excel, but they are a bit tricky and require an Excel add-in – which you can get from this external website Correspondence Analysis Basic Concepts
Overall Similarity (OS) Perceptual Maps
And finally we have what’s called an overall similarity map – or OS perceptual map.
An example of an OS is shown below – but please note that the arrows and dimensions have been added AFTER the OS map is produced. The output of an overall similarity map will ONLY show brands scattered around the map.
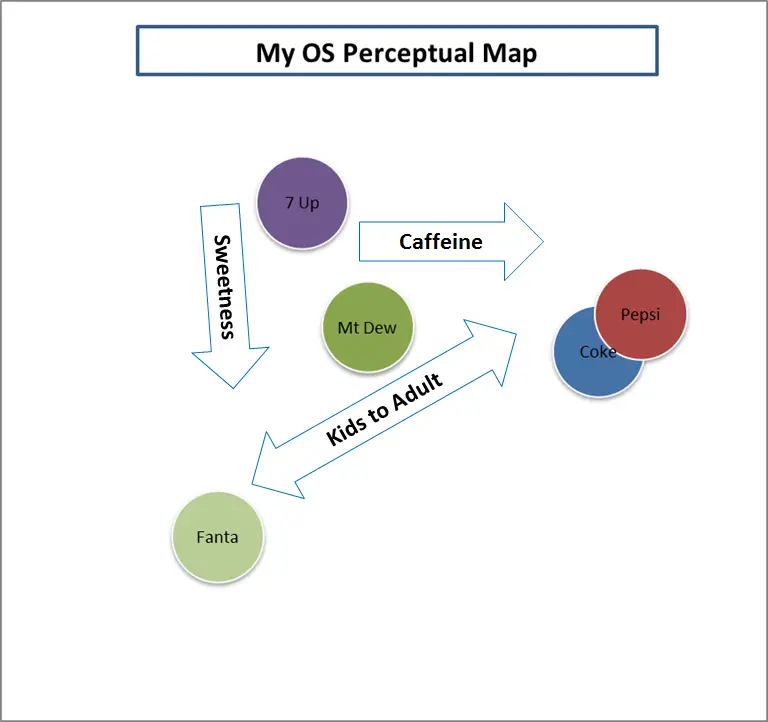
That means that an OS maps have no axes and brand attributes – and that’s because of the way this data is collected, and the type of insights that an OS map is designed to uncover.
Let’s use an example of the data collection to explain this type of map. Let’s use an example of drink brands.
- Think about Coca-Cola and Pepsi, how similar are they on a scale, where 1 = identical and 7 = complete opposites?
- Now think about Coke and Dr. Pepper how similar are they on the same scale?
We then run through every combination of brands (in sets of two) and keep asking the respondents to compare brands using the same scale.
You should note that we NOT asking them about attributes at all. For this type of map, we are not interested in brand attributes, because that will form part of our later analysis. And obviously, you can’t use too many brands because the combinations start mounting up.
The reason that we use an overall similarity perceptual map is that we get away from attribute-based thinking – which may/may not be relevant to the consumer decision – and start looking at the overall decision. That is, when consumers are faced with a decision choice, how are they thinking about the competing brands?
This is a quite valuable form of positioning analysis, provided that we can get the data. This analysis should be quite insightful because, typically, many products are not bought on a single attribute. Consumers usually look at overall value (the value propositions’]) – or the brand’s total sum of benefits.
The difficult challenge for a marketing analyst is working out the underlying dimensions, and how are consumers looking at the overall set, and what attributes or sets of attributes or combinations are they mainly relying upon.
As can be seen in the above OS map, three underlying decision-making factors have been identified. These product dimensions are how the consumers appear to differentiate between the brands in their perceptions.
Download a free overall similarity (OS) map Excel template here: Overall Similarities (OS) Perceptual Maps
Which Perceptual Map Should I Use?
The answer to this question depends upon the company’s access to data and what is it trying to identify in the market = that is, our research objectives.
For a smaller company that does not have access to reliable consumer data on brand image, then they are really limited to a positioning map where management “guesses and estimates” the brands’ positioning in the market, as compared to competitors.
However, for larger companies that have access to suitable marketing research data and skilled analysts, I would suggest that a combination of two-attribute perceptual maps, multi-dimensional scale perceptual maps, and correspondence analysis maps can be produced from the same data set.
Two-attribute perceptual maps– particularly running multiple maps – are a great introduction to analyzing positioning and identifying determinate attributes. They are also helpful for visualization of brand positioning when making presentations and preparing reports.
Multi-dimensional scaled maps are very helpful for getting an overall assessment of the marketplace and identifying how consumers interrelate the brand attributes and to also identify direct and indirect competitors.
And finally correspondence analysis maps are helpful for measuring the relative distinctiveness of the brand and where the brand stands out as opposed to the “average” brand in the market.
Overall similarity maps should be used as the next level down our marketing insight. In this case we are getting beyond attribute-based decision-making and trying to dig into which attributes and dimensions really appear to drive consumer behavior.
I am a student: Which Perceptual Map Should I Use?
If you are a marketing student, who is seeking to show a perceptual map for a marketing plan or other marketing assignment, then you probably only need the standard two-axis (four-quadrant) perceptual map.
This is the type of perceptual (or positioning) map is the one most commonly shown and discussed in Principles of Marketing textbooks. So grab the map template here: Free Download of the Perceptual Map Template
Please note that to use this map you will need to identify most the likely determinate attributes that consumers use to make their purchase decisions. Determinate attributes are discussed on this site and there are plenty of axis ideas available as well.
If you don’t have any formal data, provided that you have a good understanding of the brands in the marketplace, you should still be able to produce a reasonable perceptual map based on your own knowledge.
If you are a student of marketing research or involved in a commercial image/brand research study, then you will probably benefit from using a multidimensional perceptual map. This type of allows you to map up to 12 brands and up to 12 product attributes onto the same map.
Types of Perceptual Maps FAQs
What are the main types of perceptual maps?
- Standard two-dimensional (two attribute) perceptual maps
- Positioning maps
- Multi-dimensional scaled (MDS) perceptual maps
- Perceptual mapping using correspondence analysis
- Overall similarity perceptual maps
What is the difference between perceptual maps and positioning maps?
Perceptual maps are constructed from real consumer data and show the positioning of brands in the minds of consumers.
Positioning maps do not map consumer perceptions and are typically used as a strategic tool to map out the future of brand positioning.
What is a multi-dimensional scaled (MDS) perceptual map?
A multi-dimensional scaled (MDS) perceptual map is a type of perceptual map that considers multiple brand and product attributes at once.
This provides a better insight into how consumers see the overall market and helps identify direct and indirect competitors, interrelationships between attributes, and brand distinctiveness.
What is a correspondence analysis perceptual map?
A correspondence analysis perceptual map is a type of perceptual map that helps measure the relative distinctiveness of a brand and where it stands out as opposed to the “average” brand in the market. It is used to determine how closely a brand is related to certain attributes and how it compares to other brands in the market.
What is an overall similarity (OS) perceptual map?
An overall similarity (OS) perceptual map is a type of perceptual map that focuses on how consumers perceive the overall similarity between brands. This type of map helps analysts understand the underlying dimensions and decision-making factors that drive consumer behavior.
Which perceptual map should I use?
The choice of perceptual map depends on your access to data and research objectives.
Smaller companies may rely on positioning maps, while larger companies with access to marketing research data may use a combination of two-attribute perceptual maps, multi-dimensional scaled perceptual maps, and correspondence analysis maps for deeper insights.
Related Articles and Information
- Using a radar chart as a perceptual map
- Using the Perceptual Map Template
- Get the Most Out of Your Perceptual Maps
- Perceptual Maps: Best Practice
- Top 12 Tips for Analyzing Perceptual Maps