Contents
How to Use the Free Perceptual Mapping Excel Template
This article outlines the key steps in creating perceptual maps using the free perceptual map template maker available for download on this website, as well as information on how to construct and interpret a perceptual map.
- Get the free Perceptual Mapping Excel Template – take me to the download page: Free Download of the Perceptual Map Template
For how to use instructions for the template, watch the video or scroll down for step-by-step information…
Why Use the Perceptual Map Template?
Unfortunately, although while appearing relatively straightforward, it is often difficult (or timely) to create an effective perceptual map in Excel from scratch, especially for users new to Excel.
Therefore, this website provides a free download of a perceptual map template that will allow you to construct a perceptual map within a couple of minutes, even if you are not overly familiar with Excel (or similar compatible spreadsheet software).
It is very handy and easy to use tool. And I would encourage all marketing students and marketing practitioners to have a copy of my perceptual template in their marketing toolbox. (See download link above).
How to Use the Template?
- Click the download link (see above)
- Open the downloaded Excel file
- Click to enable editing
- Follow the instructions in the spreadsheet
Let’s now work through the template’s instructions.
When you open the perceptual map template, it looks like this…
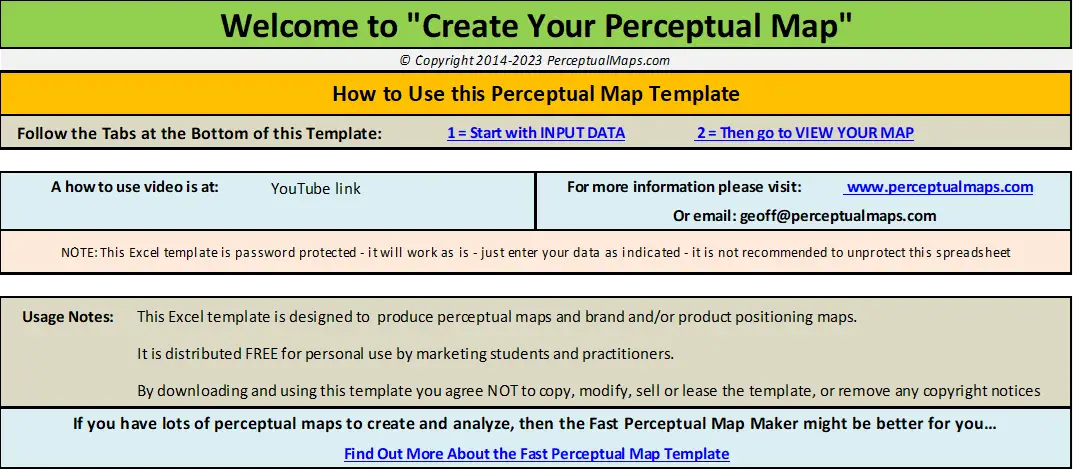
You first go to “INPUT DATA“, which you can access by selecting the tab at the bottom or clicking a link on the first page that the spreadsheet opens to (as per the image above). Then you will see the following tab in the template…
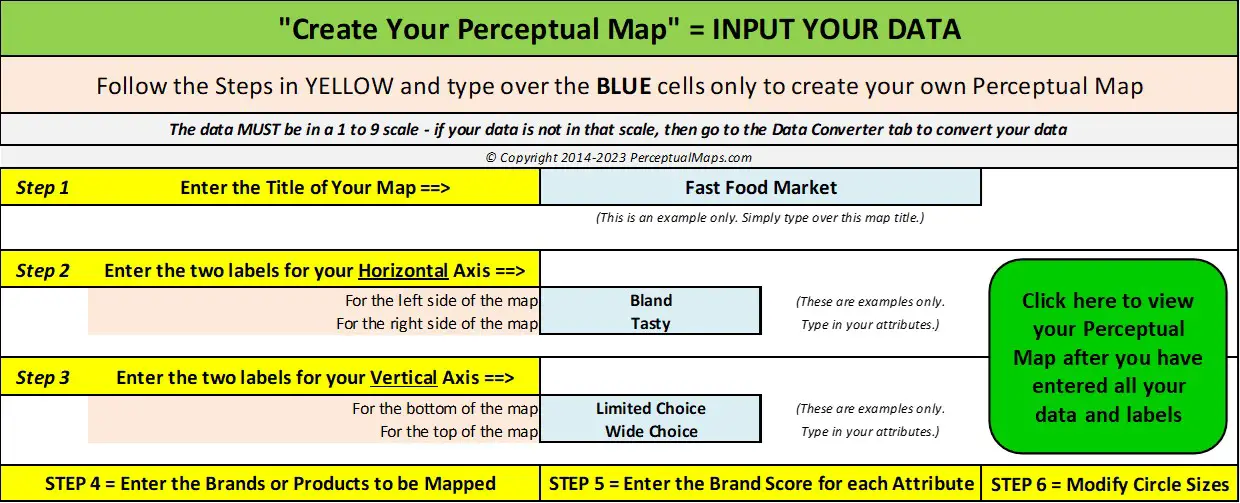
As you can see, the steps of how to use the map template are clearly outlined in bright yellow.
- Step 1 = You enter the title of your map by typing over the preset title of “Fast Food Market” (which is just an example). Important note: you only need to enter data in the grey-colored cells.
- Step 2 =Enter the names of the attributes for the horizontal (left-right) axis. Remember that the names/terms at each end should be virtually opposites.
- Step 3 =Is the same as Step 2, except this time you enter the opposite terms for the attributes on the vertical (up-down) axis.
These three steps will set-up the structure of your map automatically. This next image of the template highlights Steps 4 to 6.
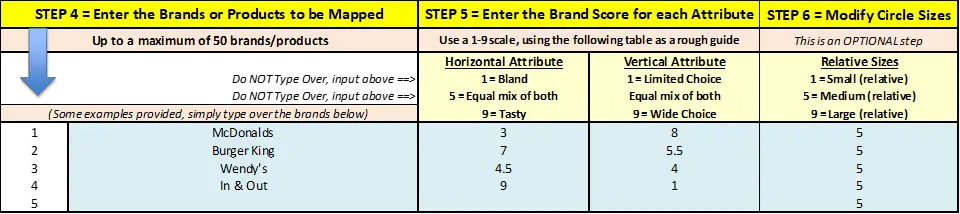
- Step 4 = In this step, you list the brands (or products, or codes) that you want to compare on the perceptual map. Again there is some example information there already that you can type over. You can add up to 50 brands on the free template.
- Step 5 =In this step you enter the data for each brand for both attributes. The templates expect data in the scale of 1 to 5 (or 1 to 9). If your data in not in one of these scales, then the template has a built-in data scale converter 0r you can review how to re-scale your data.
- Step 6 =The final step is optional in the template. If you want to make a particular brand larger in the map, you can set it to a larger (or smaller) on the map.
And that’s it – the template has automatically produced your map – you then click on VIEW YOUR MAP and its done – easy as that!!!
Of course, you will still need copy/paste your perceptual map into your report or presentation. But remember, when you paste your map, paste is as a PICTURE (image) to ensure that the map’s formatting is maintained.
What Does the Perceptual Map Template’s Output look like?
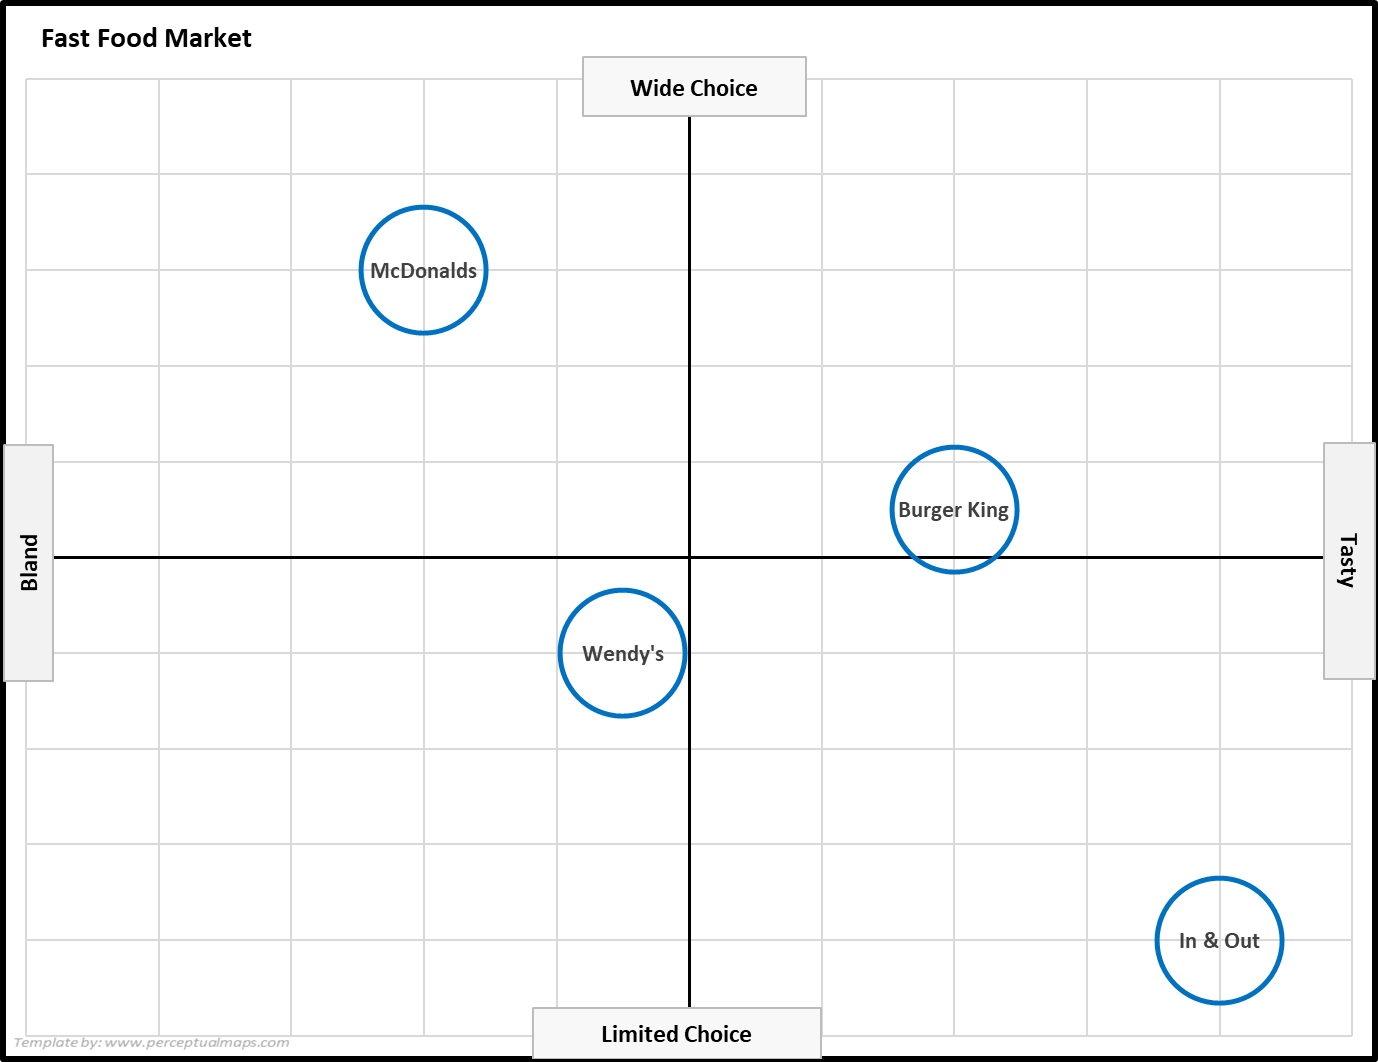
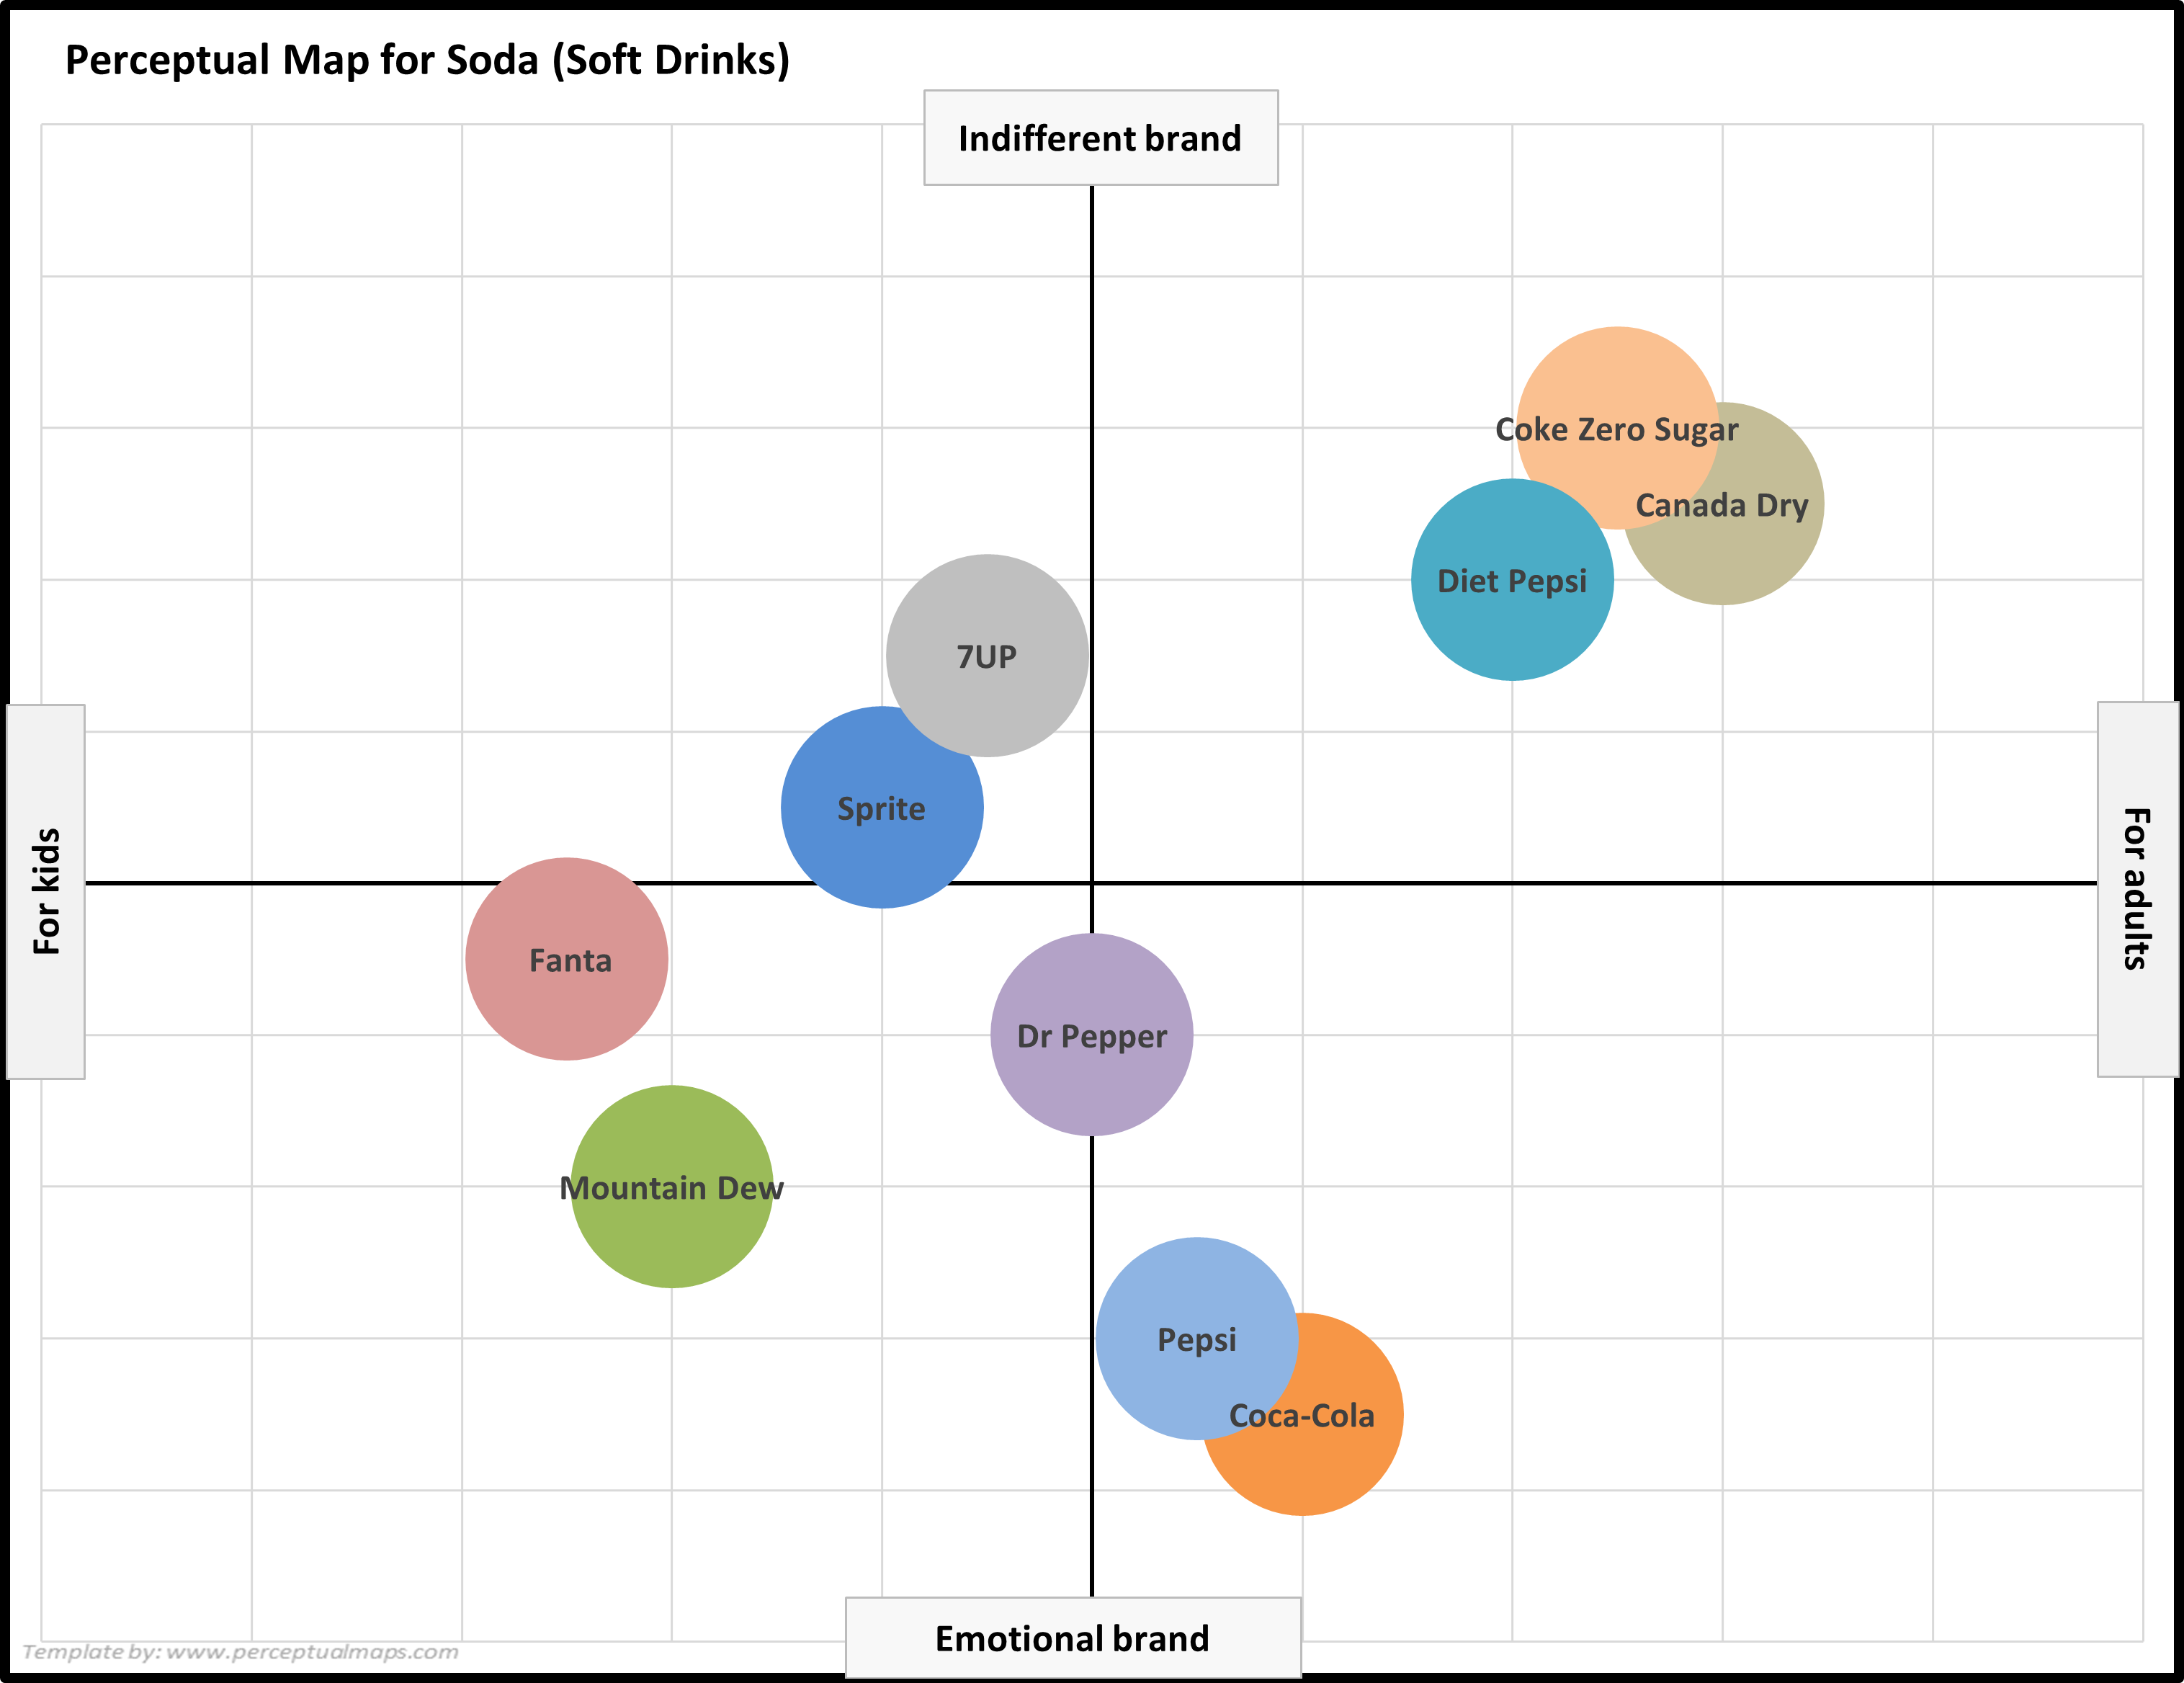
The template automatically produces four differently formatted versions of the SAME perceptual map. This allows you to pick and choose the map design that best suits your needs.
As shown below, these four perceptual map variations are:
- Brand names in bubbles/circles without colors
- Brand names in bubbles/circles with colors
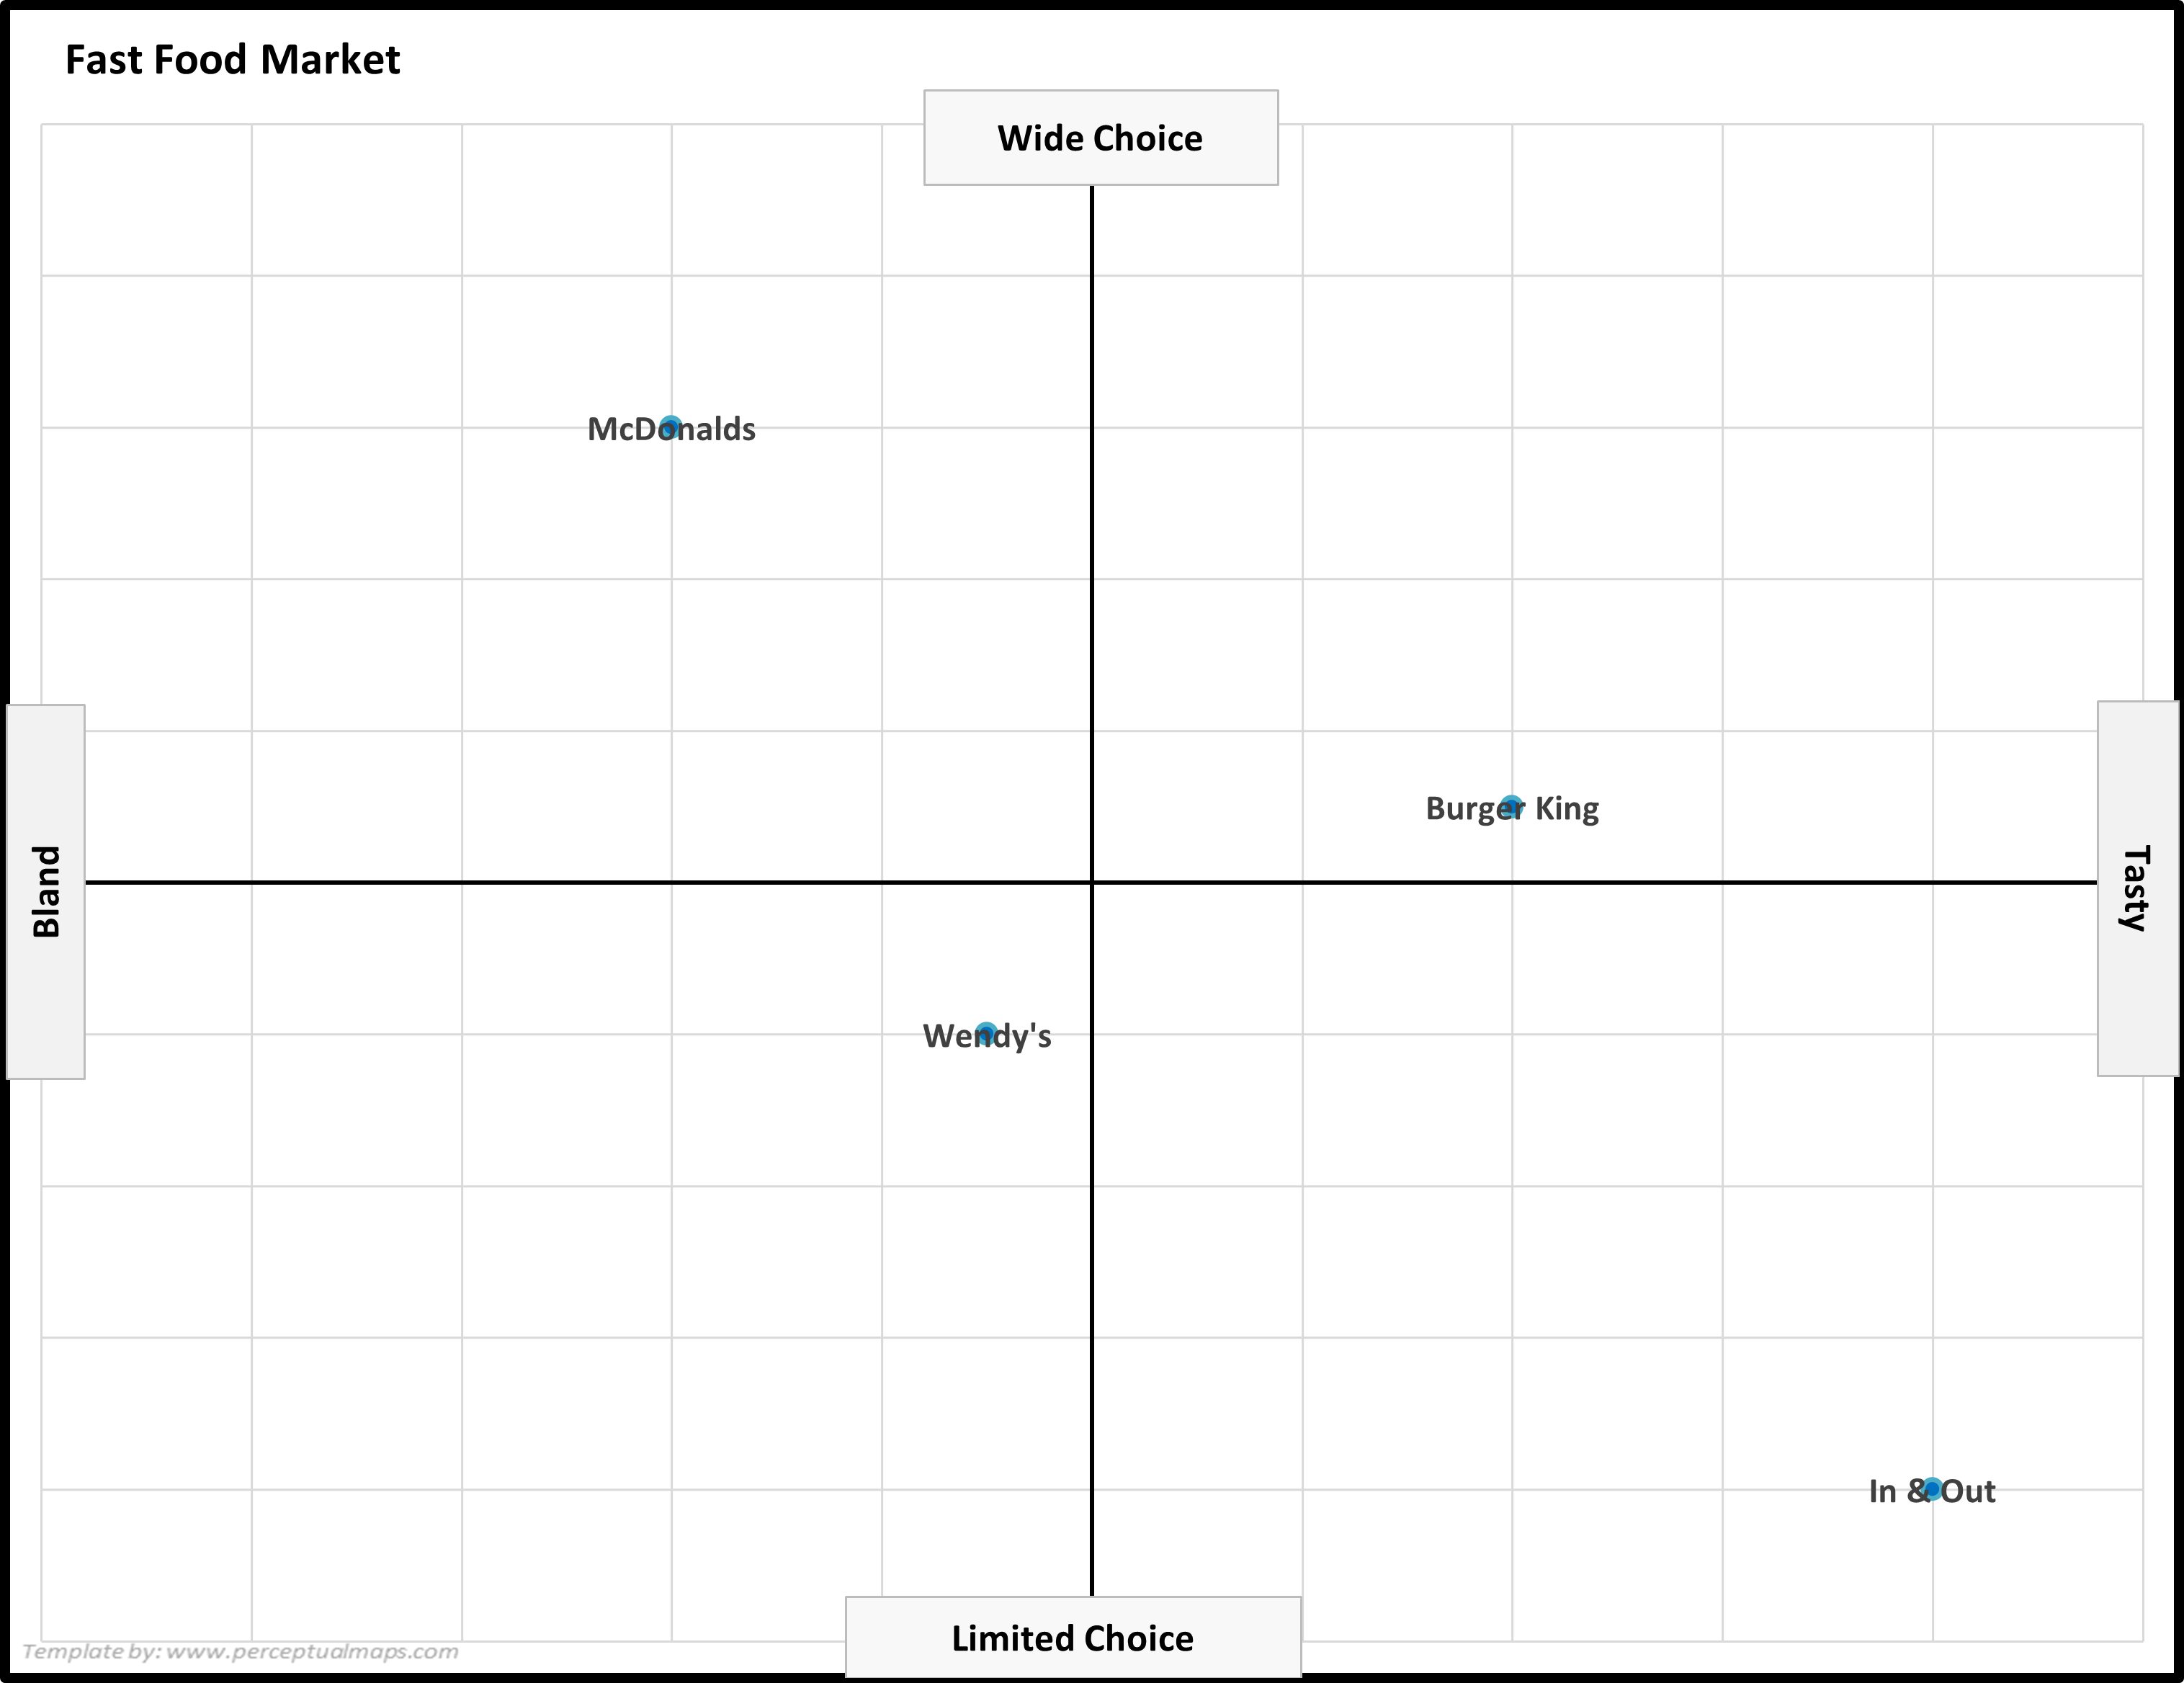
- Brand names with dots/symbols (no bubbles/circles)
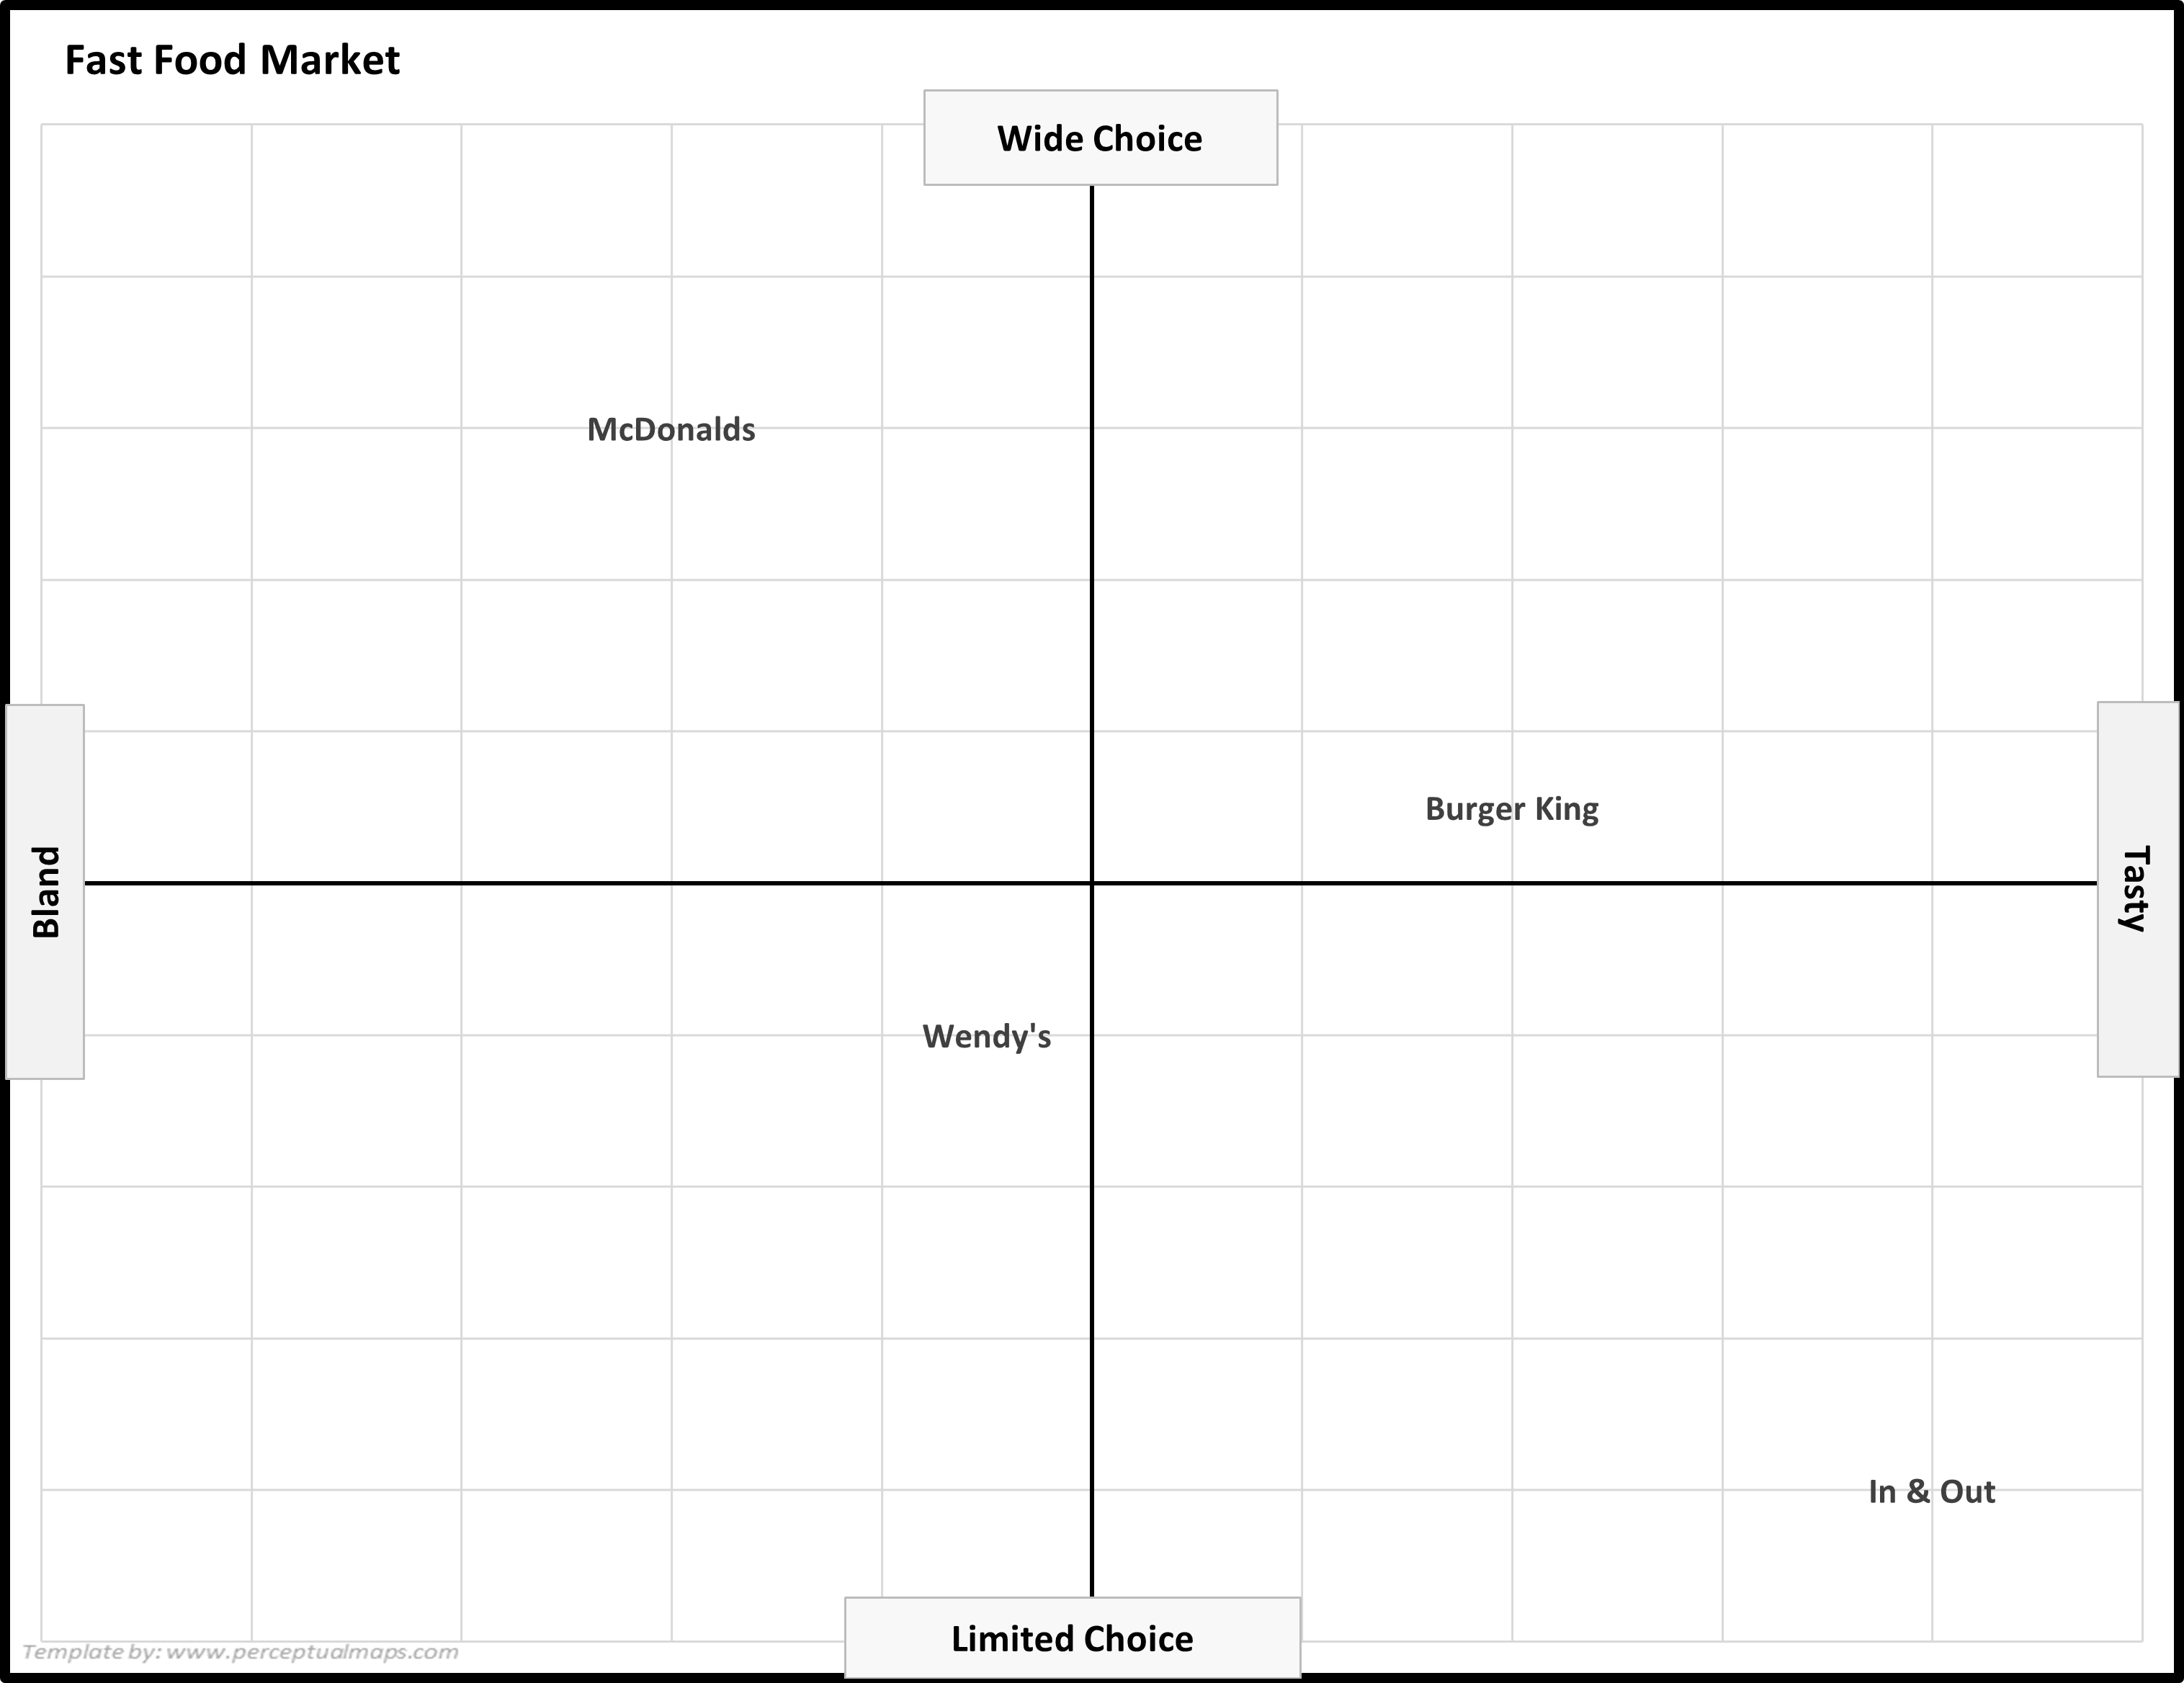
- Brand names only
EXAMPLE MAP: Brand names in bubbles/circles without colors
EXAMPLE MAP: Brand names in bubbles/circles WITH colors
EXAMPLE MAP: Brand names with dots/symbols (no bubbles/circles)
EXAMPLE MAP: Brand names only
Further Information
- Perceptual Maps: Best Practice
- What is a Perceptual Map?
- Top 12 Tips for Analyzing Perceptual Maps
- Why Use Perceptual Maps?
- Benefits of Perceptual Maps
- Limitations of Perceptual Maps
Check Out Multi-Map Template
If you need to construct more than one perceptual map – which is the most common scenario – then you might be better off with the Fast Perceptual Map Maker. This template allows the input of up to 25 attributes and up to 25 brands, which then enables you to review up to 300 perceptual maps amazingly fast. A great analysis tool.
Perceptual Maps 4 Marketing
- The Home of the Free Perceptual Map Excel Template
- Downloaded over 100,000 times since 2013
- Always free, always will be
- Ideal tool for marketing students, analysts, and practitioners