Contents
Key Differences between Perceptual and Positioning Maps
Perceptual maps and positioning maps are interrelated concepts and the terms are sometimes used interchangeably. But there are key differences between them, which means that they should be used and interpreted differently.
As marketers, with all heard the terminology – sometimes people talk about perceptual maps and sometimes they talk about positioning maps.
In this article, I will explore the subtle differences between perceptual and positioning maps. There is a distinction, but often this distinction is lost in practical application. Therefore, the context of the discussion is often helpful in understanding what people are meaning when they refer to perceptual and/or positioning maps.
Please scroll down for the full article, or review the following video…
Key Differences: Perceptual Maps vs Positioning Maps
Let’s start with a quick checklist…
- Perceptual maps show how consumers PERCEIVE the positioning of brands
- Perceptual maps are based upon consumer data or research
- Perceptual maps are helpful as stand-alone tools and help provide a range of market insights (see this article)
- Positioning maps shows the positioning of brands, as measured objectively by the firm
- Positioning maps need to be used in conjunction with perceptual maps and are less helpful if used independently
- Perceptual maps mainly look at CURRENT, as well as historical/past, brand, positioning
- Positioning maps mainly considers current positioning, but with a focus on FUTURE positioning goals
What is a Perceptual Map?
The word “perceptual” comes from the word “perception“, which means the consumer’s understanding, opinion and assessment of a brand or a product. As a result, a perceptual map shows the consumers’ perception (understanding, opinion, assessment, etc.) of the positioning of competing brands in a market.
In most cases, perceptual maps are constructed from a market research survey of consumers, where they are asked a series of image and brand questions. In some cases, perceptual maps may be constructed from the collective knowledge of experienced managers who estimate how consumers perceive the positioning of competing brands.
Therefore, a perceptual map shows the PERCEPTION of positioning of competing brands – not the desired positioning goals nor the actual positioning of the brands.
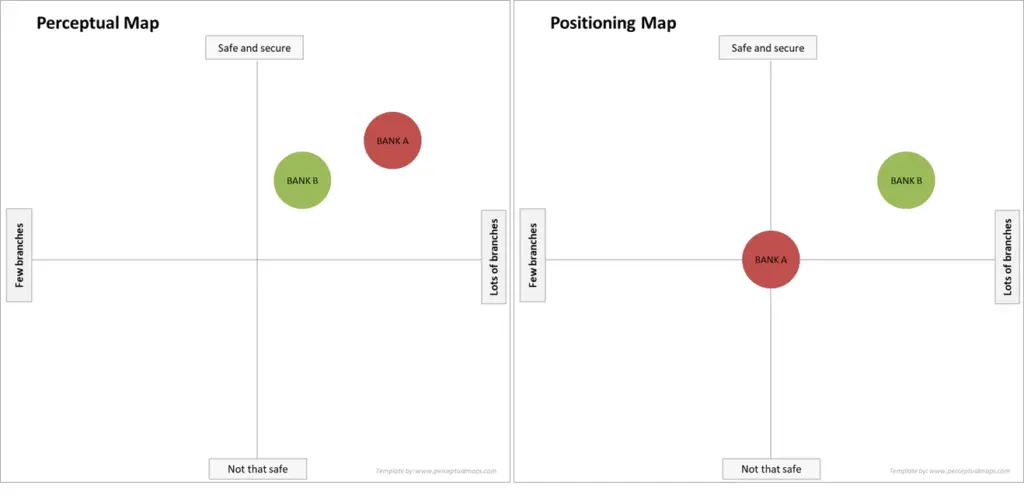
This is important to understand as usually there is a difference between reality and perception. As an example, “What is the safest bank?” – consumers may PERCEIVE it as Bank A because of their brand image, but from a financial ratio perspective the safest one is actually Bank B. (Please refer to the example perceptual maps below.)
So this means that in a perceptual map we are measuring consumer perception of positioning, not technical reality. (Please see this related article on Perception is Reality.)
What is a Positioning Map?
A positioning map is a similar concept, but the main difference is that we are NOT mapping consumer perception – instead, we are mapping either actual (technical) positioning and/or positioning goals.
The design of a positioning map is identical to a perceptual map as it is presented as a scatter (or bubble) chart and maps the positioning of competing brands. That is why there is sometimes confusion between these terms as they present in the same format.
But an important distinction is that we are guessing or estimating current and future consumer perceptions. And often our future projections are based on where we want the brand to be, rather than what may be realistic positioning in the future.
As a result, positioning maps are more planning and strategic based, whereas perceptual maps reflect a brand’s positioning in the mind of the consumers.
Using Perceptual and Positioning Maps Together – Checking Market Reality
As mentioned above, for a positioning map we are demonstrating actual (or real) positioning.
For example, let’s continue our banking example (for Bank A and Bank B), using the two positioning attributes of:
- Has lots of branches
- Is safe and secure
The two maps below highlight the difference between a perceptual map and a positioning map.
On the left, we have a perceptual map – based upon a survey of the perceptions of consumers. As you can see, consumers perceive Bank A as having more branches and being safer and more secure.
However, on the right we have a positioning map – which is based upon a count of branch locations and an analysis of financial ratios.
As you can see, in reality Bank B has more branches and is also stronger financially, but Bank A is perceived as being superior to its competitor on both of these attributes.

This difference between perception and reality is important information for both banks.
- Bank A can identify that their communication campaigns have been effective in demonstrating their branch accessibility and financial security.
- And Bank B can identify that they had not been overly successful in communicating these strong attributes to consumers.
Using Perceptual and Positioning Maps Together – Setting Positioning Goals
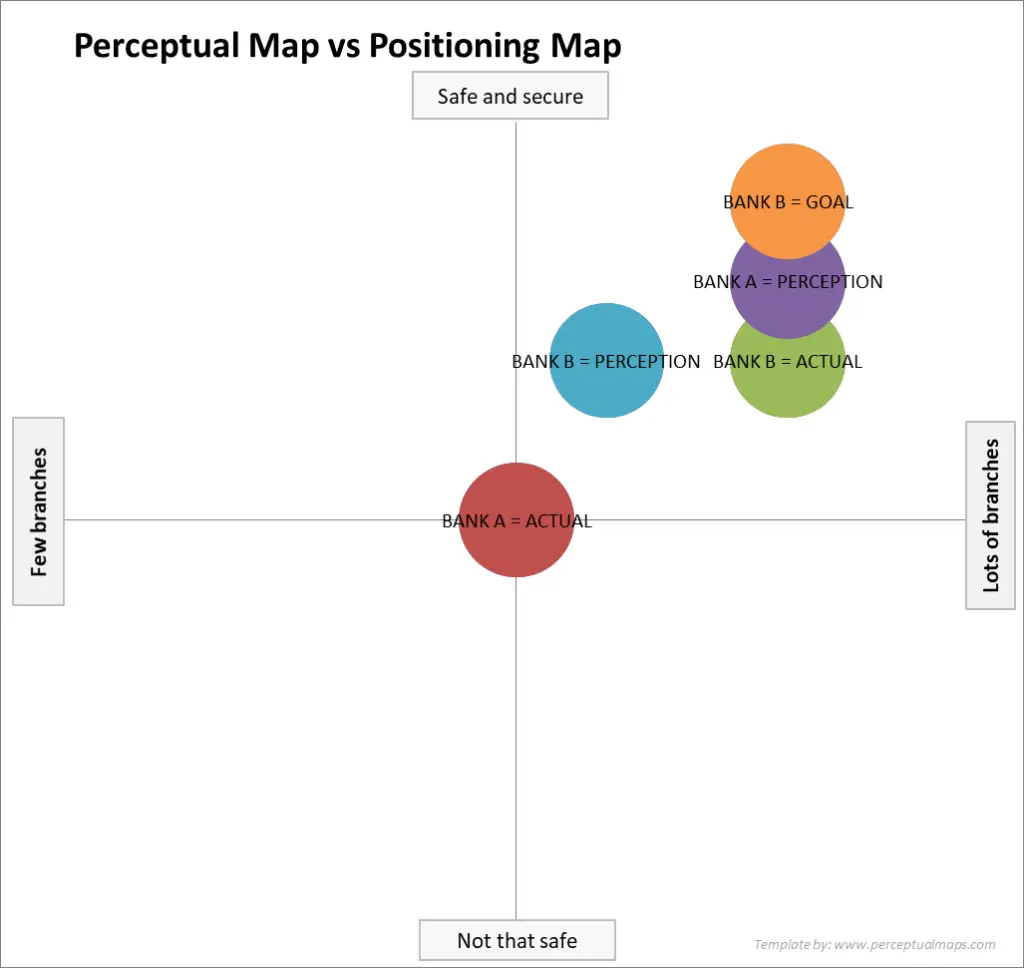
Another use of a positioning map is to overlay it with a perceptual map and set desired positioning goals. As shown below, we have merged a perceptual map and a positioning map into one diagram, plus added a positioning goal for Bank B.
This is an effective planning and internal communication tool, as it clearly identifies that current market reality as well as highlighting the communication challenge facing the brand (Bank B in this case).

A Positioning Map NEEDS a Comparison to a Perceptual Map
In both of these examples of how to use a positioning map, you will note that a perceptual map is also required for comparison. We need to understand how consumers (or specific target markets) perceive the positioning of the brands in the market to make a positioning map work for us.
Without knowledge of the perception of consumers, a positioning map is a less valuable tool. If we don’t know the actual image of the brand in the market it makes it very difficult for us to set a suitable positioning (or repositioning) goal.
Perceptual Maps Do NOT Need a Comparison to a Positioning Map
Perceptual maps have multiple benefits to a marketer and provide a number of insights to help guide future marketing actions. This means that they can be beneficial in a stand-alone manner and do not need a comparison to a positioning map.
Key Takeaways
- While these two maps are often used interchangeably, they have distinct differences
- Perception refers to how consumers view and interpret the brands in the marketplace
- A key goal of using a perceptual map is to gain a better understanding of how consumers perceive a brand in relation to competing brands
- But it’s important to note that this is based on consumer perception and not necessarily the reality of a brand’s performance in the marketplace, as per my banking example above
- A positioning map is a visual representation that shows how a brand wants to be positioned relative to its competitors
- This type of map is not necessarily based on consumer perception, but rather what the brand aims to achieve
- And obviously our competitors also have positioning goals, so we need to consider their positioning intentions as well
- In addition to perceptual and positioning maps, there are other terms that are often used interchangeably in marketing, such as brand positioning, product positioning, and competitive positioning
FAQs Perceptual Maps versus Positioning Maps
How is a perceptual map different from a positioning map?
The main difference lies in what each map represents.
A perceptual map shows the consumer’s perception of different brands in the market, while a positioning map represents the brand’s actual or intended positioning as determined by the company.
Are perceptual maps and positioning maps interchangeable?
While they can look similar and may use similar data, they have distinct uses and should not be used interchangeably. A perceptual map is useful in understanding how the consumer sees your brand relative to competitors, while a positioning map can help in strategic planning and setting brand positioning goals.
How are perceptual maps created?
Perceptual maps are typically created using market research data, where consumers are asked various questions about their perceptions of different brands. These perceptions are then plotted on a graph to create the map.
How are positioning maps created?
Positioning maps are created based on the company’s understanding of their brand’s current position and where they want it to be in the future. This can be based on various internal data points and strategic goals.
Is one type of map more important than the other?
Both maps provide valuable, but different, information. A perceptual map provides insights into consumer perceptions, while a positioning map can guide strategic planning.
They can be used together to provide a more comprehensive view of brand positioning.
Does a perceptual map show the company’s desired position in the market?
No, a perceptual map does not show the company’s desired position. Instead, it shows how consumers currently perceive the company’s position in relation to its competitors.
Does a positioning map show the consumers’ perceptions of the brand?
No, a positioning map does not directly show the consumers’ perceptions. It illustrates the company’s understanding of their brand’s current position and where they intend it to be in the future.
What happens if the perceptual map and positioning map do not align?
If the two maps do not align, it suggests a disconnect between how the company wants its brand to be perceived and how it is actually perceived by consumers. This can be a signal that the company needs to adjust its marketing and branding strategies.
How can the difference between the two maps be beneficial to a company?
Understanding the difference between a perceptual map and a positioning map can help a company align its strategic goals (positioning map) with the reality of consumer perceptions (perceptual map).
If there’s a discrepancy between the two, the company can adjust its strategy to better align with consumer perceptions or work on changing those perceptions.
Can the two maps ever be identical?
While it’s theoretically possible for the two maps to be identical, it’s unlikely due to the different data sources and purposes. The perceptual map is based on consumer perceptions, which can vary and may not fully align with the company’s internal views and strategic goals reflected in the positioning map.
Related Articles and Information
- Top 12 Tips for Using Perceptual Maps
- How to Effectively Use Perceptual Maps
- Make 100’s of Perceptual Maps Really Fast
- Top 12 Tips for Using Perceptual Maps
- Positioning Strategy
- Why and How to Reposition a Brand?
- Free Download of the Perceptual Map Template
