Contents
Want to Make a Perceptual Map in PowerPoint?
Some students and marketers still prefer, or feel comfortable, in making their perceptual maps in PowerPoint. Although not as precise and as easy as using the free Excel perceptual map generator available on this website, it is still an effective approach, particularly for college assignments and reports.
There are two approaches to making a perceptual map with PowerPoint, these are:
- Use the free perceptual map template for PowerPoint, available for free download below, or
- Make a perceptual map yourself using PowerPoint, as described further below as well
Option 1 = Using the FREE Perceptual Map Template for PowerPoint
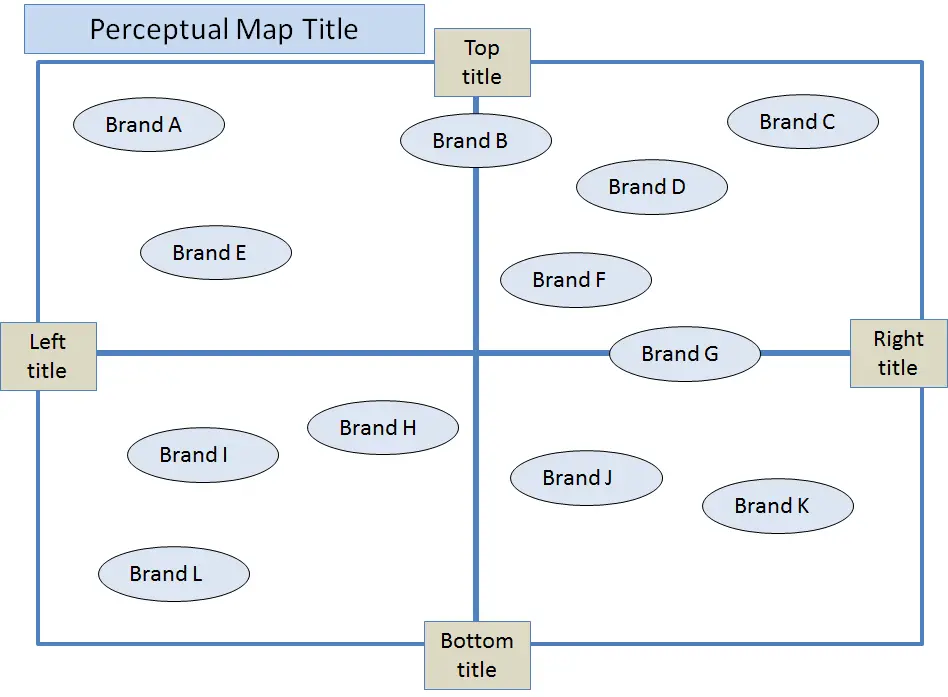
This is the easiest approach of your two choices. Simply click the following link to download the PowerPoint slide that contains the perceptual map template – which should look like the following PowerPoint slide.
Click here to download the free perceptual map PowerPoint template.
When you open the file – the map will look like this…
How to Use and Format the PowerPoint Perceptual Map Template?
Steps to use the perceptual map template for PowerPoint after you have downloaded it (please see link above):
- Click on “Perceptual Map Title” to type in your own map title
- Click on the four boxes on the ends of the attributes (e.g. “left title“, etc.) to type in the names of your attributes (note: resize all these boxes if necessary)
- Click on the ovals (e.g. “Brand A”, etc.) to rename the circles to the brands (or firms) that you are mapping
- Delete the ovals you don’t need, or copy/paste more ovals if required
- Move the ovals/brands around your perceptual map to reflect your data (or your market understanding)
- Click on all map elements and copy/paste to Word (or other program) for use in your report or presentation.
- To change any of the colors – click on the box or oval – then select “Shape Fill” from the top menu
Option 2 = Making Your Own Perceptual Map Using PowerPoint
Building a perceptual map from start to finish using PowerPoint is relatively easy. Your positioning map should look a lot like the above template map when you are finished.
The steps to follow are:
- Start with a new slide – and choose “Blank“
- Insert a square/rectangle as the outside border (click “insert/shapes”) – then go to “space fill” and select “no fill” – then use “shape outline/weight” to change the thickness of the border
- Insert a horizontal line and a vertical line for the axes – again use “shape outline/weight” to change their thickness (and there is a color option here too)
- You will then need to insert “text boxes” for the names of your perceptual map and its axis titles – just insert, type, resize (if necessary) and move – you should also center text and add a background color if required
- You also use the same system (as step 3) for your brand (and attributes if required) – that is, using a text box, which is then moved to the right position on the perceptual map.
- If you want to change the shape of any text box -say to a circle – then click on the text box, which should bring up “format” on the top menu – then click on “edit shape” and select whatever shape you want to use.
Preferred Option = Use the FREE EXCEL Perceptual Map Template
Probably the fastest and easiest way to make a perceptual map (or several maps quickly) is to use the free Excel template for perceptual maps available on this website.
It requires no prior knowledge of Excel and it far more accurate and precise – and it’s quick and very easy to use.
Check out the video overview below – or go straight to the Free Download of the Perceptual Map Template
USING PERCEPTUAL MAPS
- Check out our Perceptual Maps: Best Practice guide
- Brand Attributes Ideas for Perceptual Maps
- Brand Personality Attributes for Perceptual Maps
- Top 12 Tips for Analyzing Perceptual Maps
Perceptual Maps 4 Marketing
- The Home of the Free Perceptual Map Excel Template
- Downloaded over 100,000 times since 2013
- Always free, always will be
- Ideal tool for marketing students, analysts, and practitioners
Take me to the download page: Free Download of the Perceptual Map Template