Contents
- 1 Best Practice and Tips for Using Perceptual Maps
- 2 1. Make Many Different Perceptual Maps Using Different Attributes
- 3 2. Use Determinant Attributes for your Maps
- 4 3. Analyze Market Segments – Not the Overall Market
- 5 4. Make Maps that Include both Key and Indirect Competitors
- 6 5. Map Brand Image Over Time
- 7 6. Be Realistic about Positioning Goals
- 8 7. NEVER Put Price and Quality on the Same Map
- 9 8. Always Connect the Perceptual Map Findings Back to the Market
- 10 9. Try to Use Consumer Data
- 11 10. Maps Work Best for Low-Involvement Purchases
- 12 11. Watch Out for Brands Always in the Middle of the Map
- 13 12. Identify Brands that Score Highly on One Attribute Only
- 14 13. Always Make a Perceptual Map in Excel
- 15 14. Use My Mapping Tools and Resources
Best Practice and Tips for Using Perceptual Maps
The Hidden Power of Perceptual Maps and Their Analytical Abilities
Perceptual maps are a powerful tool for understanding competitive positioning and the effectiveness of marketing campaigns and brand management over time.
Most marketing textbooks, and indeed quite a few strategy books too, will quickly cover the key aspects of perceptual mapping.
But, unfortunately, in many cases these textbooks only provide a hurried and limited discussion that leaves the reader with the impression that perceptual maps are a simple visual tool designed to magically describe brand positioning in a single map.
And, adding to the underselling of this surprisingly analytical tool, is the description of perceptual mapping of only ever using a simple two-axis (two attributes only) bubble or scatter chart.
With such an underwhelming introduction to perceptual maps in Marketing 101 (and similar subjects), it is no wonder that many marketers end up underappreciating and underutilizing perceptual mapping tools for their analysis and internal communications.
As you may guess by now, I’m a big fan of perceptual maps and I see them and an integral part of analyzing and understanding brand positioning and brand distinctiveness. And that’s why I have provided a free Excel template for perceptual mapping on this website since 2013.
If you have not downloaded at yet, please grab yourself a free download at Free Download of the Perceptual Map Template. It’s an important analysis tool for every marketer to have in their analytical toolkit.
Perceptual Maps are Simple in Design Only, But Not in Their Analysis
Because of the simplistic way that perceptual are portrayed in most marketing textbooks, there is a perception that these maps are easy to use from an analytical perspective. That is, the analyst or marketer simply chooses two attributes to place on the map and suddenly the brand’s positioning and distinctiveness is immediately revealed.
However, while perceptual (especially the two-axis maps) are very simple in their design and communication, this is where this simplicity ends. We need to approach perceptual mapping as we would any other analytical technique and delve into what the maps are telling us.
If we rely upon a single map only, then we have done no analysis! Analysis involves digging into our customer image data (or other relevant information) and finding market insights about our positioning – that is, pieces of information that we did not know before.
Randomly picking two attributes to map on a perceptual map is not going to get us there. That is why I have developed this perceptual maps best practice guide for you to follow. Below are tips and guidance that will ensure that you get the most out of your perceptual mapping – and, of course, identify valuable market insights.
Let’s get started… you can either review the following video, or scroll down for the written article.
1. Make Many Different Perceptual Maps Using Different Attributes
Tip 1 is to construct many maps – not just one. We will usually have access to an array of consumer image data, so why not use it?
A critical aspect of perceptual map is to analyze and understand the market. If we pick two attributes and only map those, then we are imposing our view of the market on the final map and we are not guided by the perception of consumers.
By looking at dozens, if not more maps, then we will gain a much stronger understanding of the market and how we are positioned in the minds of consumers across multiple attributes and multiple combinations of attributes. It should reveal insights and relationships that we were unaware of.
Let’s use a simple example and compare the following two perceptual maps – they are both for the soda (soft drink) market.
The first map uses the attributes of:
- fun to serious image and
- sweet taste to not sweet taste
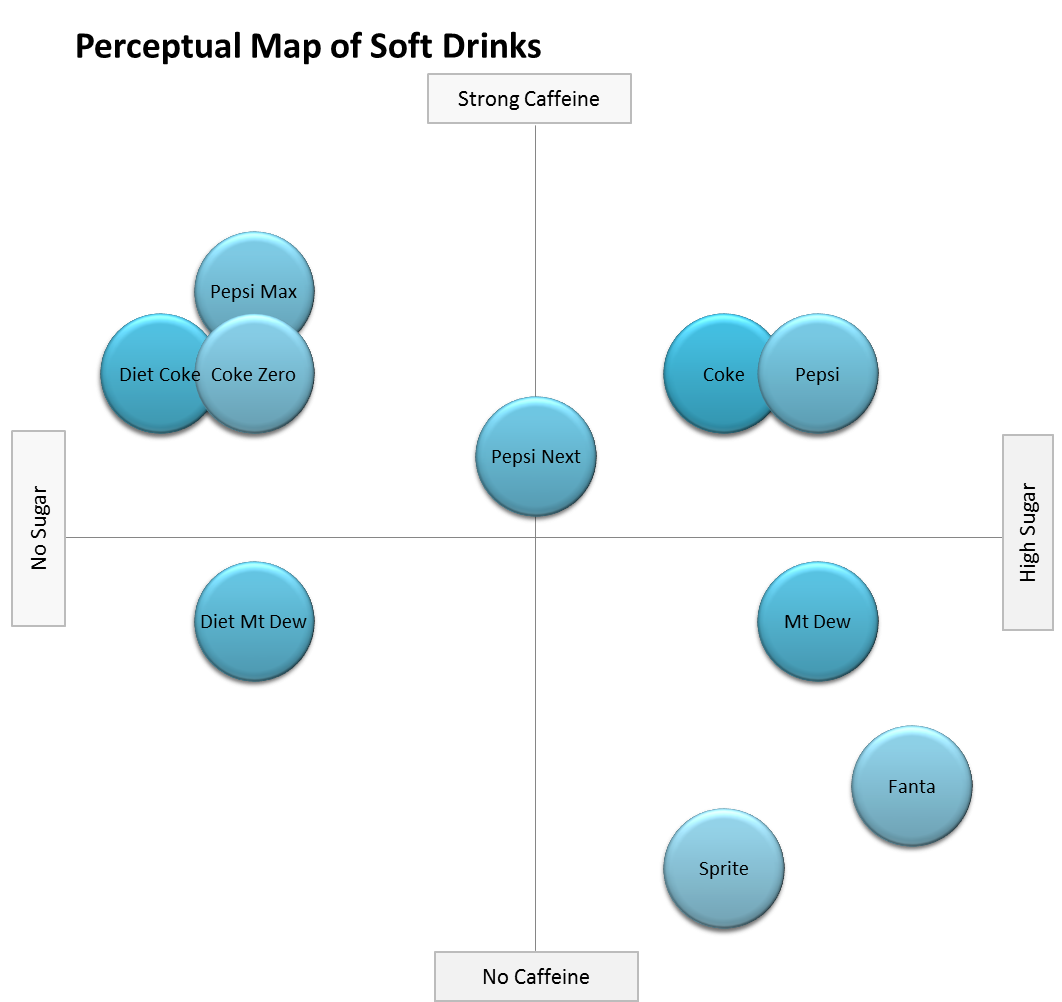
While the second perceptual map uses the attributes of:
- high sugar to no sugar content and
- strong caffeine to no caffeine
And, as you can see below, the positioning of the competing brands differs in both maps.
For example, in the first map, Pepsi, Sprite, Fanta, and Mt Dew are positioned close together. This means that they are perceived by consumers as being quite similar for the two attributes used on the map.
But, in the second map, these four brands are spread out and these brands are now perceived as being less similar based on these two different attributes.
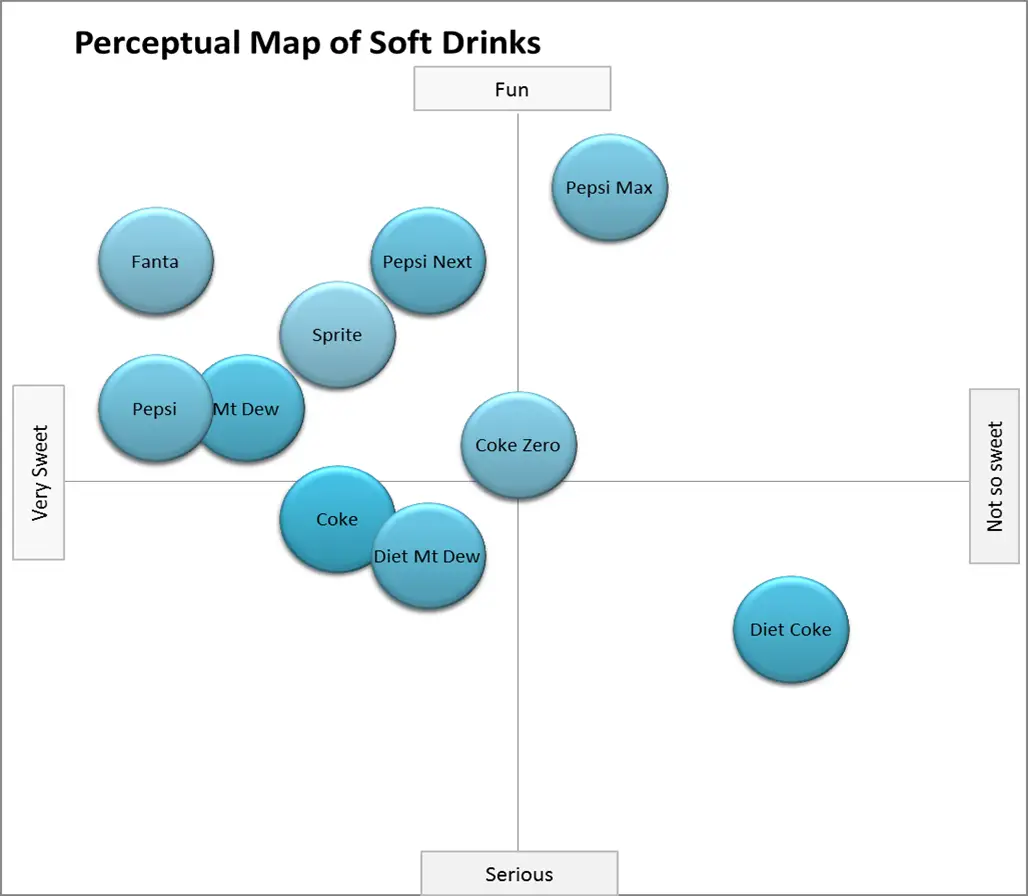
Example soft drink perceptual map
To help you construct and review as many perceptual maps as possible – please check out my Excel template that enables you to Make 100’s of Perceptual Maps Really Fast.
It’s offered for a super low-price and will save you many hours of analysis time and take your mapping analysis to the next level. And to also help you construct lots and lots of maps, also review my list of possible axis attributes.
2. Use Determinant Attributes for your Maps
What are determinant attributes? A determinant attribute is the product feature or benefit that determines the final choice between competing brands. It may not be an overly significant attribute in the overall product bundle, especially in very competitive and cluttered markets.
Why is this the case? Minor attributes will often “rise to the top” when a consumer chooses (distinguishes) between two (or more) brands in their final consideration set. This will happen when ALL the major and most important attributes are matched (or quite similar) in the consumer’s perception.
For example, we may choose an airline for a long flight because they have more in-flight food choices. A consumer will rely on this less important attribute if they assess that the competing brands were somewhat similar for attributes like:
- Location/destination
- Times/dates of travel
- Fare flexibility and refund options
- Price points
- Seating/comfort
- And so on
If these above attributes are perceived (judged) by the consumer to be relatively similar, then they will consider less important and minor attributes to help them make their purchase choice.
The attributes used by the consumer to make their final choice is known as a determinant attribute (as it has determined the consumer’s choice). Think of it as “what determines” the brand choice.
You can read more about determinant attributes here, or review this external journal article on identifying determinant attributes.
Check out this ad for Air New Zealand – they are promoting the quality of their in-flight food. How do you choose between competing and similar priced airlines?

3. Analyze Market Segments – Not the Overall Market
Market segments have their own needs, preferences, and consumer perceptions – that why we have undertaken the segmentation process. Virtually all businesses use some form market segmentation (only a few dominant worldwide firms can be successful with mass-marketing, e.g. Google, Apple).
This means that there is little point in analyzing the overall market – particularly when we are unlikely to compete “overall”. Marketing plans are typically built around target markets – so our perceptual maps should take the same view.
So, where possible, it is a great idea to construct a perceptual map which shows each segment’s view of the market and the competitors. As we know, market segments are groups of consumers that share common views, behaviors and/or profiles.
Each segment view is likely to produce a distinctive perceptual map. If we just look at the market overall, we will get an “average” of perception, which is quite unhelpful as we are generally pursuing a defined target market in our marketing actions.
By drilling down to market segments – and beyond into niche segmentation – we are likely to uncover how different segments and groups of consumers perceive our brand and our competitors. Indeed, this analysis might result in the identification of market opportunities or perhaps a rethinking of our overall segmentation structure and approach.
Looking at a segment and niche level helps us understand the strength of our brand, is positioning and distinctiveness, across a broad array of consumers and possibilities.
Obviously, we need to work with the consumer data that we have captured (most likely from surveys), however there is usually a good opportunity to segments that the respondents (consumers) in the survey. Even if we have not asked demographic questions, we can segment by attitudes, brand usage, brand awareness, product category usage, media consumption – and any other relevant and potential segmentation variables we may have asked about.
Whatever your segmentation approach, make sure that you produce maps that reflect the perception of your target markets – not the view of the overall market (or average consumer).
4. Make Maps that Include both Key and Indirect Competitors
We tend to usually only include our direct competitors in our perceptual maps. This is because they are top-of-mind to us as marketers and it becomes a reflex action to focus upon our direct competitors only.
But this is generally NOT good marketing practice, as the biggest dangers to our long-term success are often indirect and new innovative competitors.
And unfortunately for us, most consumers do not think in terms of direct competitor sets. They think in terms of their needs.
For example, is a consumer considering going to McDonalds for lunch only choosing between fast food options, or are they thinking about grabbing a snack, a coffee, or even making food at home?
And for a greater discussion of this concept, please review my article on using perceptual maps to understand competitor sets.
To help make more sense of this, let’s look at an example…
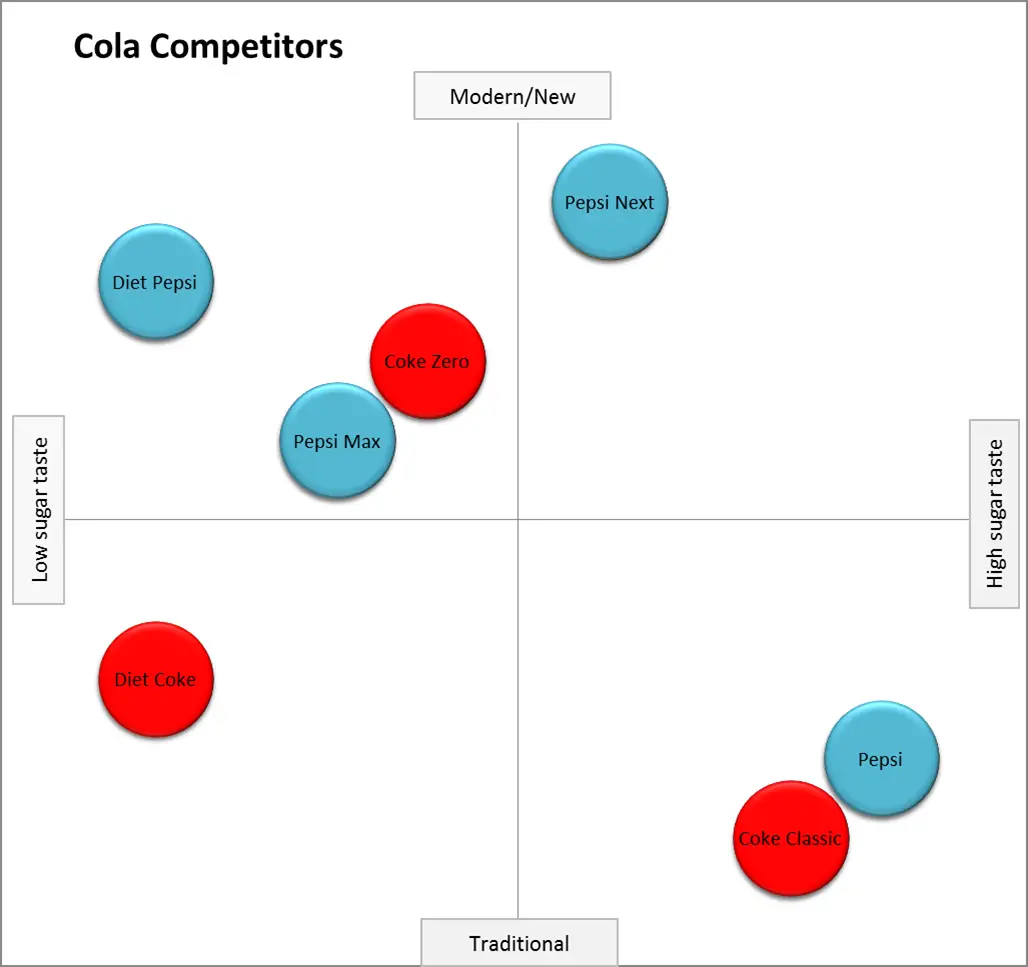
Let’s check out the next two perceptual maps:
- the first one shows indirect competitors (or substitute products), where the color codes show the direct competitors and
- the second map shows the direct competing brands only
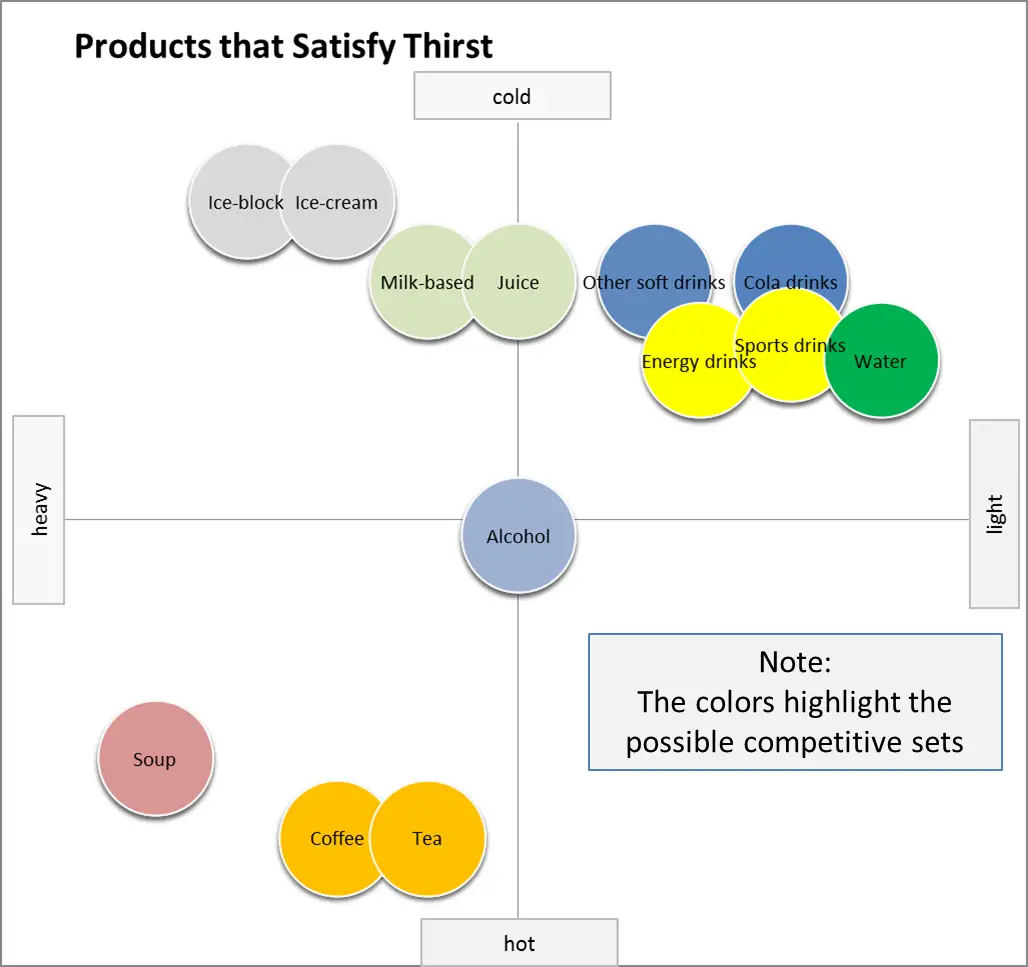
Looking at indirect competitors is extremely useful, as often these alternate product categories pose the biggest competitive risk.
In mature markets, market shares tend to be relatively stable due to brand loyalty and established and somewhat repetitive consumer behavior. But new players and substitute products can have a major, and sometime disruptive impact on the market and change consumer behavior.
A good way of thinking about perceptual mapping analysis is to consider the tool as a microscope we can zoom in and out of the marketplace.
By zooming out you can take a very broad look at the indirect competition for an overall consumer need. Then you can zoom in to have a look at the brand/product category level, and you can even zoom in further to look at direct competing products offered within each brand.
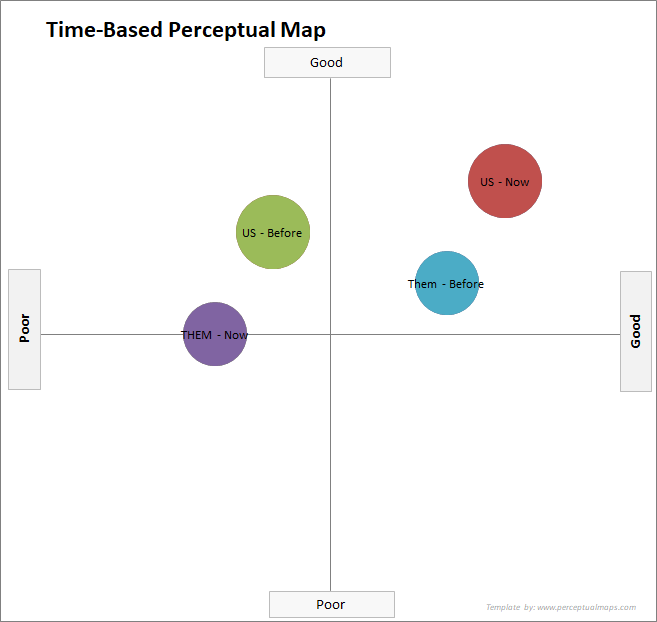
5. Map Brand Image Over Time
Perceptions change over time because brands develop, competitors evolve, new players enter the market, and even consumer needs change in the long-term.
That’s why, where possible, we should also map the position of key brands last year to see how they have evolved. This approach will provide valuable insight into competitors and their likely marketing strategy.
In this simple perceptual map, you can see that our firm (US) is now in a much stronger place than our key competitor (THEM) on a before and after position. Although this is quite a simple map, it is a powerful piece of communication to demonstrate that our positioning strategies are working well.
And of course, time-based perceptual maps allow us to more effectively assess the overall impact of our brand-building marketing strategies. In essence, many of our brand-building approaches are designed to strengthen our relative brand positioning and to create increased brand distinctiveness and differentiation.
Therefore, showing our brand position over time and how we have been tracking relative to competitors is a powerful way of assessing whether or not we have been achieving and delivering on our brand goals.
To limit perceptual maps to one point in time is a mistake. It’s like trying to analyze our sales results based upon one month’s data only. In terms of sales, we generally look at trends, improvements, targets, relative market share, and so on. That is, we have multiple benchmarks in place. Therefore, we need to do the same with our analysis of our perceptual maps.
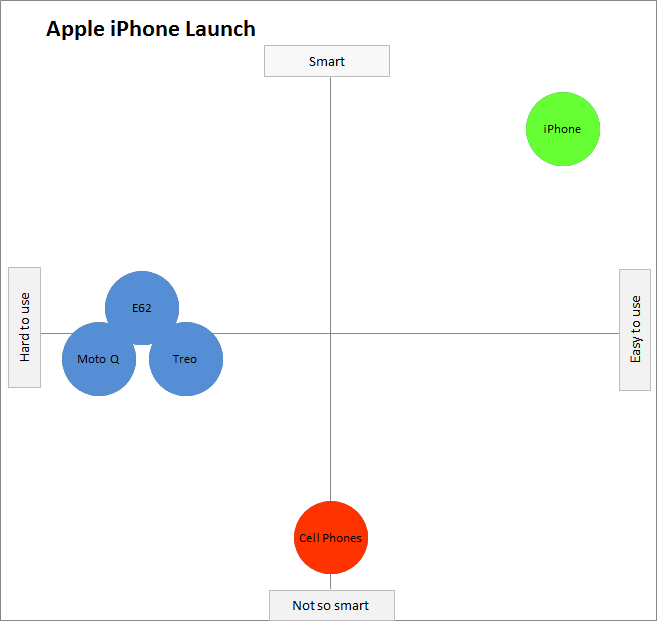
6. Be Realistic about Positioning Goals
For some unknown reason, it has become a myth that the top-right corner of a perceptual map is the BEST approach to positioning. I am not sure why this view exists among marketers, but there is no basis for it, as it will depend upon the attributes and how the map is constructed.
In reality, top-right corner of the map is not always the best positioning approach, nor it is always achievable. When setting long-term positioning goals, we need to be realistic about what is possible, especially if our competitors have similar plans!
Below is the map that Steve Jobs used when launching the first iPhone in 2007. Apple went straight for the top right hand corner as a later entrant into the smart phone market. And, for them, it was a huge success and transformed Apple into one of the most successful firms in the world.
But… most firms are not Apple. They do not have their level of innovation, skills, resources, and brand equity – so, unfortunately, for most firms we need to be a little less ambitious and a little more realistic in most cases.
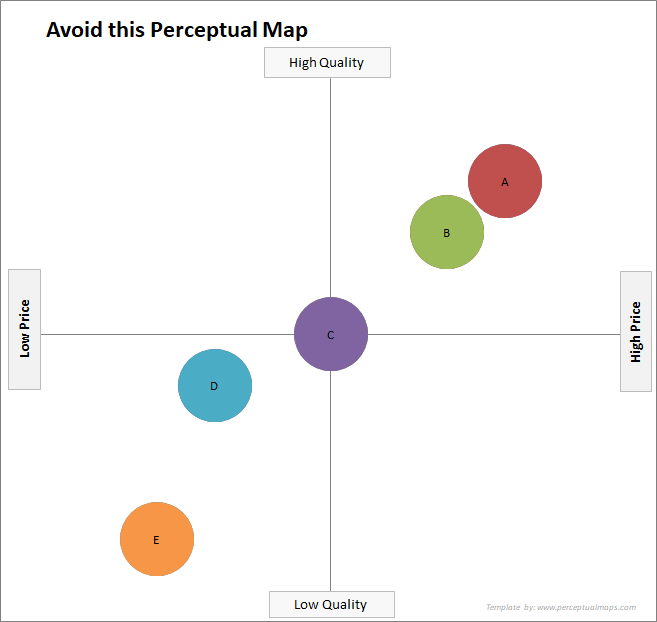
7. NEVER Put Price and Quality on the Same Map
You will note that I put the word NEVER in capitals. For some reason, price and quality are often shown online, and even in some marketing textbooks, as the “standard” perceptual map example.
But… this is a map that you should NEVER use.
Why?
Because consumers usually connect price and quality in their minds, especially for product categories where they lack purchasing experience. This means that you will end up with a highly correlated map, as essentially you are mapping the same attribute twice.
As you can see in this map, the brands are mapped in a diagonal pattern. This means that the two axis dimensions are strongly correlated in the mind of the consumer.
In fact, any time you have the brands mapped in a correlated fashion (either positively, neutrally or negatively correlated) we will need to replace one of the attributes in the map to provide more insight, as the map’s differentiation is reliant upon one attribute only (as consumers are viewing the attributes as overly similar).
8. Always Connect the Perceptual Map Findings Back to the Market
A perceptual map is an analytical tool. It is helpful to help our understanding of the market. We need to combine this information with other data and marketing metrics.
For example:
- What is happening to sales and market share?
- What are our competitors doing with their marketing mix?
- Are there new players?
- And so on – we need to try and identify WHY consumer perceptions are changing in this manner.
By combining perceptual findings with other marketing analytics and metrics, we can start to develop an understanding of the key relationships in the marketplace. We can actually learn a lot about the market and consumer behavior by analyzing our competitor’s actions.
By doing this, we are taking this perceptual map tool to the next level. In many cases, I would be cautious about relying on perceptual mapping alone – the same way that I am cautious about relying upon any single marketing metric.
Marketing analysis requires us to integrate the information that we have to construct an overall and logical view of the marketplace. We can construct an overall and evolving story about the market. We can develop a basic marketing mix model that will help guide our future marketing decisions.
The marketplace is integrated, so our marketing analysis also needs to be integrated. And changes in brand positioning, distinctiveness, perceived differentiation – are critical components in analyzing what is happening to our brand as the market, consumers, competitors, and our marketing mix design evolves over time.
9. Try to Use Consumer Data
The most useful perceptual map is one that is derived from valid consumer survey data. This gives us a true consumer viewpoint and helps provide insightful perceptual maps.
But valid and reliable consumer surveys are expensive and online surveys may not be reliable due to sampling issues. This means that we may need to construct our maps based on our “guesses”.
When we do this, we need to make sure that we “think like a consumer” – and ideally like a consumer in a specific market segment. And that’s where brand personas might come in handy.
It is critical that we do not impose OUR view on the marketplace. In business reality, I have seen this too many times – where a senior manager will perceive the market from their own perspective, rather than thinking as if they were a target market consumer.
While I agree, this is a difficult skill set, but can be constructed over time through understanding and reviewing the marketplace and available market data. Without perceptual maps from a consumer perspective, we are constructing hypothetical positioning maps that are unlikely to yield any insight and are more likely to result in poor marketing and brand positioning decisions going forward.
10. Maps Work Best for Low-Involvement Purchases
Positioning is a more critical marketing factor in low-involvement purchases.
These type of purchases, such as those made in a supermarket or convenience store, are made quickly and with reduced evaluation. Typically the consumer relies on their own recall of the brand’s positioning (like share-of-mind and a memory of the key benefits).
This means that clear and distinctive positioning is likely to deliver good sales results in a supermarket-style shopping environment – making the tracking of consumer perceptions very important.
However, with high-involvement products, consumers spend longer in the information search and evaluation phases of the buying process. In these buying situations, they look beyond just the brand’s key positioning and consider the overall value proposition. Please see this article on the difference between positioning and a value proposition.
Therefore, high-involvement products are less likely to be relied upon one or two attributes only and a consumer is looking for a package of attributes. As a result, alternative perceptual mapping tools such as multi-dimensional scaled maps are more helpful.
11. Watch Out for Brands Always in the Middle of the Map
If you are reviewing several perceptual maps and you observe that one of the brands always tends to sit around the middle of all maps. This indicates a problem with the brand – that consumers do not have a clear understanding of it, so they will tend to give it a middle score on most attributes in a consumer survey.
This branding problem is known as under-positioning.
It would be suggested to REMOVE under-positioned brands from perceptual maps. The problem is with the limited awareness and understanding of the brand in the marketplace, rather than their position on a perceptual map being a deliberate and intentional marketing strategy.
If we maintain an under-positioned brand in our output of perceptual maps (and even include them in management reports) it appears that the brand has taken a “middle market” position – when in fact this is NOT the case.
12. Identify Brands that Score Highly on One Attribute Only
The opposite of the above issue of under-positioning is, of course, over-positioning. Over-positioning is where a brand is too tightly positioned typically using a poor strategy of:
- Tightly defined list of benefits in combination
- Very narrow niche target market
- Limited suitability of usage
Over-positioned brands are easy to identify with perceptual maps, as they score very highly on one or two attributes only and either score consistently in the middle range or at the lower end for all other attributes.
This means that in one, maybe two, perceptual maps they will almost jump off the map (in comparison to competitors) for a particular attribute. That is, they stand out potentially on that attribute only.
In addition, over-positioned brands will generally have a very limited market share in terms of units, but will generally be able to charge a price premium to their very small market base of consumers. Therefore, the analysis of market share and price premium metrics in conjunction with perceptual maps and their data will quickly and easily identify extremely niched brands.
13. Always Make a Perceptual Map in Excel
I’m not sure why anybody would want to make a perceptual map outside of Excel – particularly when you can make it precisely using the free perceptual mapping Excel template available on this website.
But as a marketing lecturer, I often saw students attempting to make perceptual in Word or PowerPoint.
Although Word or PowerPoint can work “OK”, we are approximating the map only and we don’t have a perceptual map that we can easily update and review over time.
And as we are mapping actual consumer survey data in most cases, then let’s treat it like REAL data and map it precisely in an Excel chart (remember to get my free template).
14. Use My Mapping Tools and Resources
The good news is that there are lots of FREE tools on this website to get you started on your perceptual mapping analysis journey.
The FREE Tools (available for immediate download)
- To make a map quickly and easily, grab the Free Download Excel Template for Perceptual Maps (downloaded over 100,000 times since 2013, and updated annually).
- A free Excel template download for making a MDS Perceptual Map. For more information, please see Multi-Attribute Perceptual Maps
- A free Excel template download for making an Overall Similarity Perceptual Map. For more information, please see… Overall Similarities (OS) Perceptual Maps
- A free Excel template to Create and Bubble Chart for Mapping
- And also review Using a Radar Chart as a Perceptual Map
- Free Download of this Perceptual Maps Best Practice Guide (a summary of this article in PDF form)
The PREMIUM Tools (also available for immediate download)
- If you need to review and analyze dozens, or even 100’s, of different maps following a brand image survey, then check out our Premium Fast Mapping Excel Template – where you can review lots of map really fast!
- While the free version of the multi-dimensional scaling (MDS) template is available above, if you require a larger template (more brands and attributes), take a look at the premium MDS template.
Not Sure of Which Map to Use? Check Out this Video…
PERCEPTUAL MAP EXAMPLES
- Example Perceptual Maps for Breakfast Cereals
- Example Perceptual Maps for Streaming Services
- Example Perceptual Maps for Restaurants
- Example Perceptual Maps for Smart Phones
- Example Perceptual Maps for Soda (Soft Drinks)
- Example Perceptual Maps for Candy Bars
- Example Perceptual Maps for Fast Food
- Example Perceptual Maps for a Coffee Shop
- Example Perceptual Maps for Retailers
- Lots more examples of perceptual maps