Example Perceptual Maps for Retailers
Below you will find two different example perceptual maps for major retailers.
Two variations of perceptual maps have been provided below (using different product and/or brand attributes), in order to give you a choice of the map that best suits your needs.
You should note that each mapping approach will “paint a different picture” of the market, which may help provide insight into the relative brand positioning strategies.
IMPORTANT NOTE: These example maps have been provided for educational purposes only and are estimates of brand positioning only, and should not be relied upon for decision-making. Perceptual maps used in marketing should always be based upon current and valid consumer image data.
The list of retailers positioned on these example perceptual maps are:
- Walmart
- Amazon
- Kroger
- Costco
- Walgreens
- The Home Depot
- Target
- Lowe’s
- Rite Aid
- Best Buy
- Dollar General
And the four product and/or brand attributes that have been used to create these two example perceptual maps are:
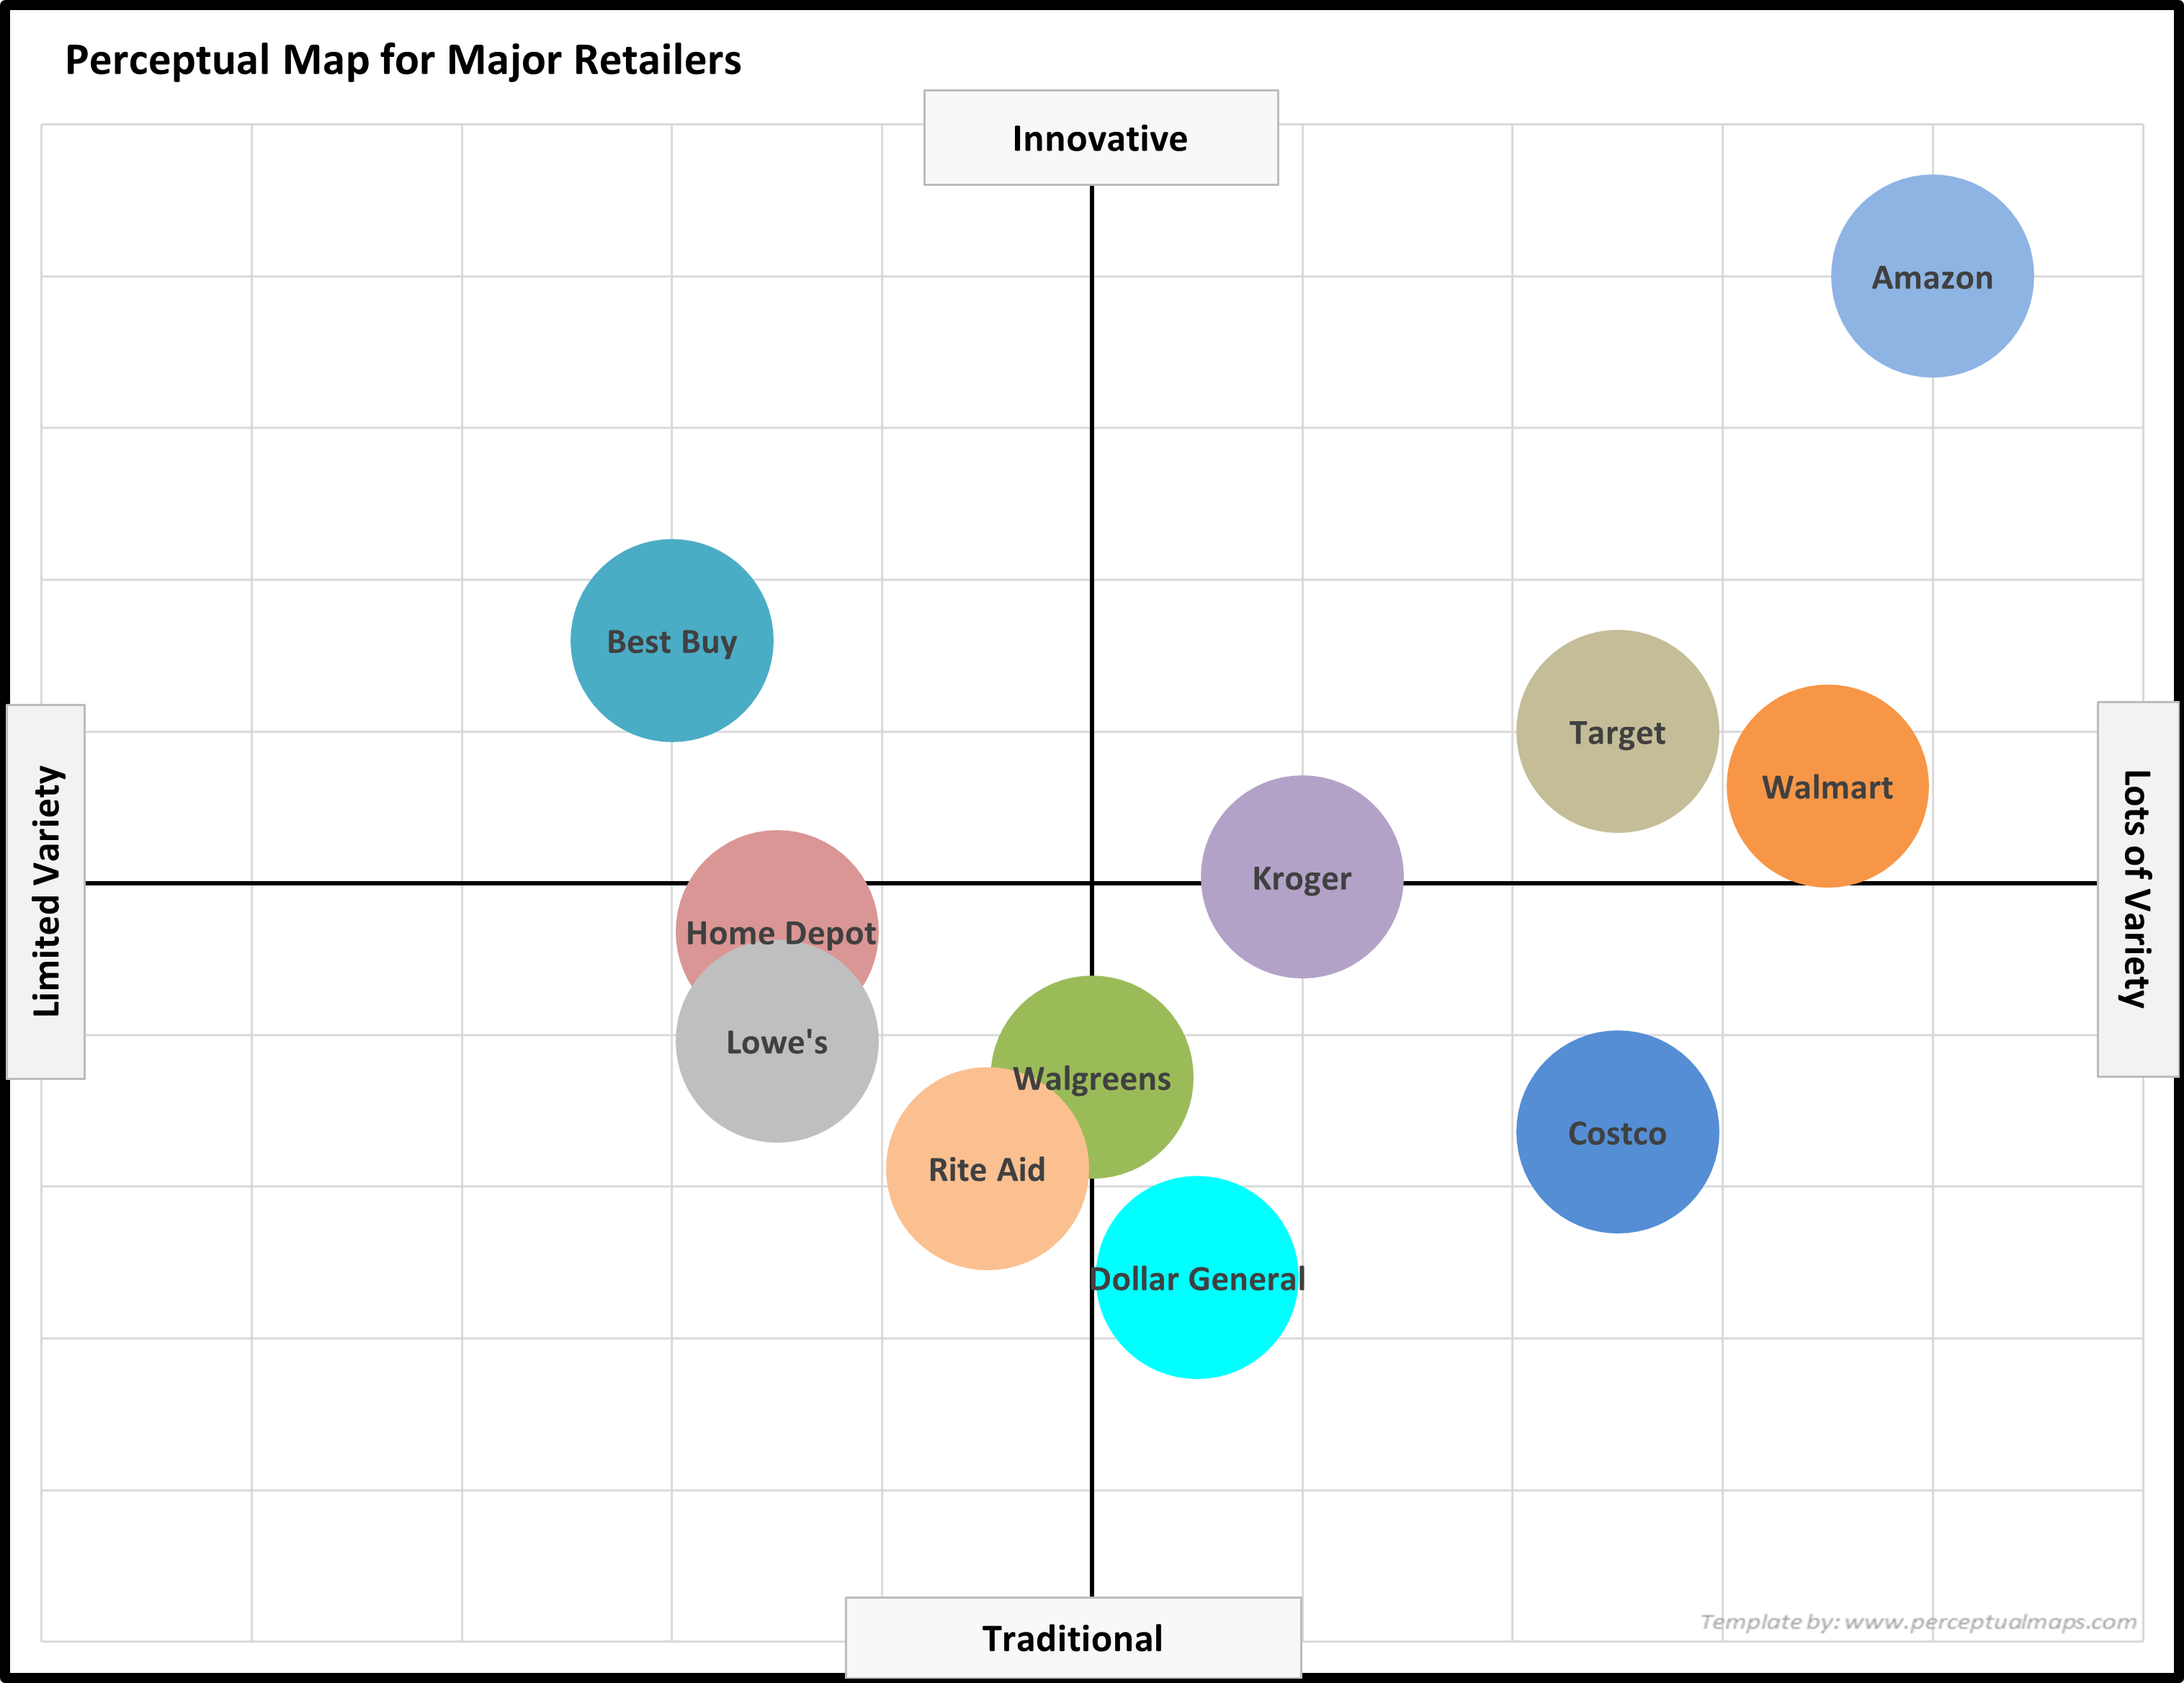
- PERCEPTUAL MAP 1 = Using the positioning attributes of:
- traditional to innovative and limited variety to lots of variety
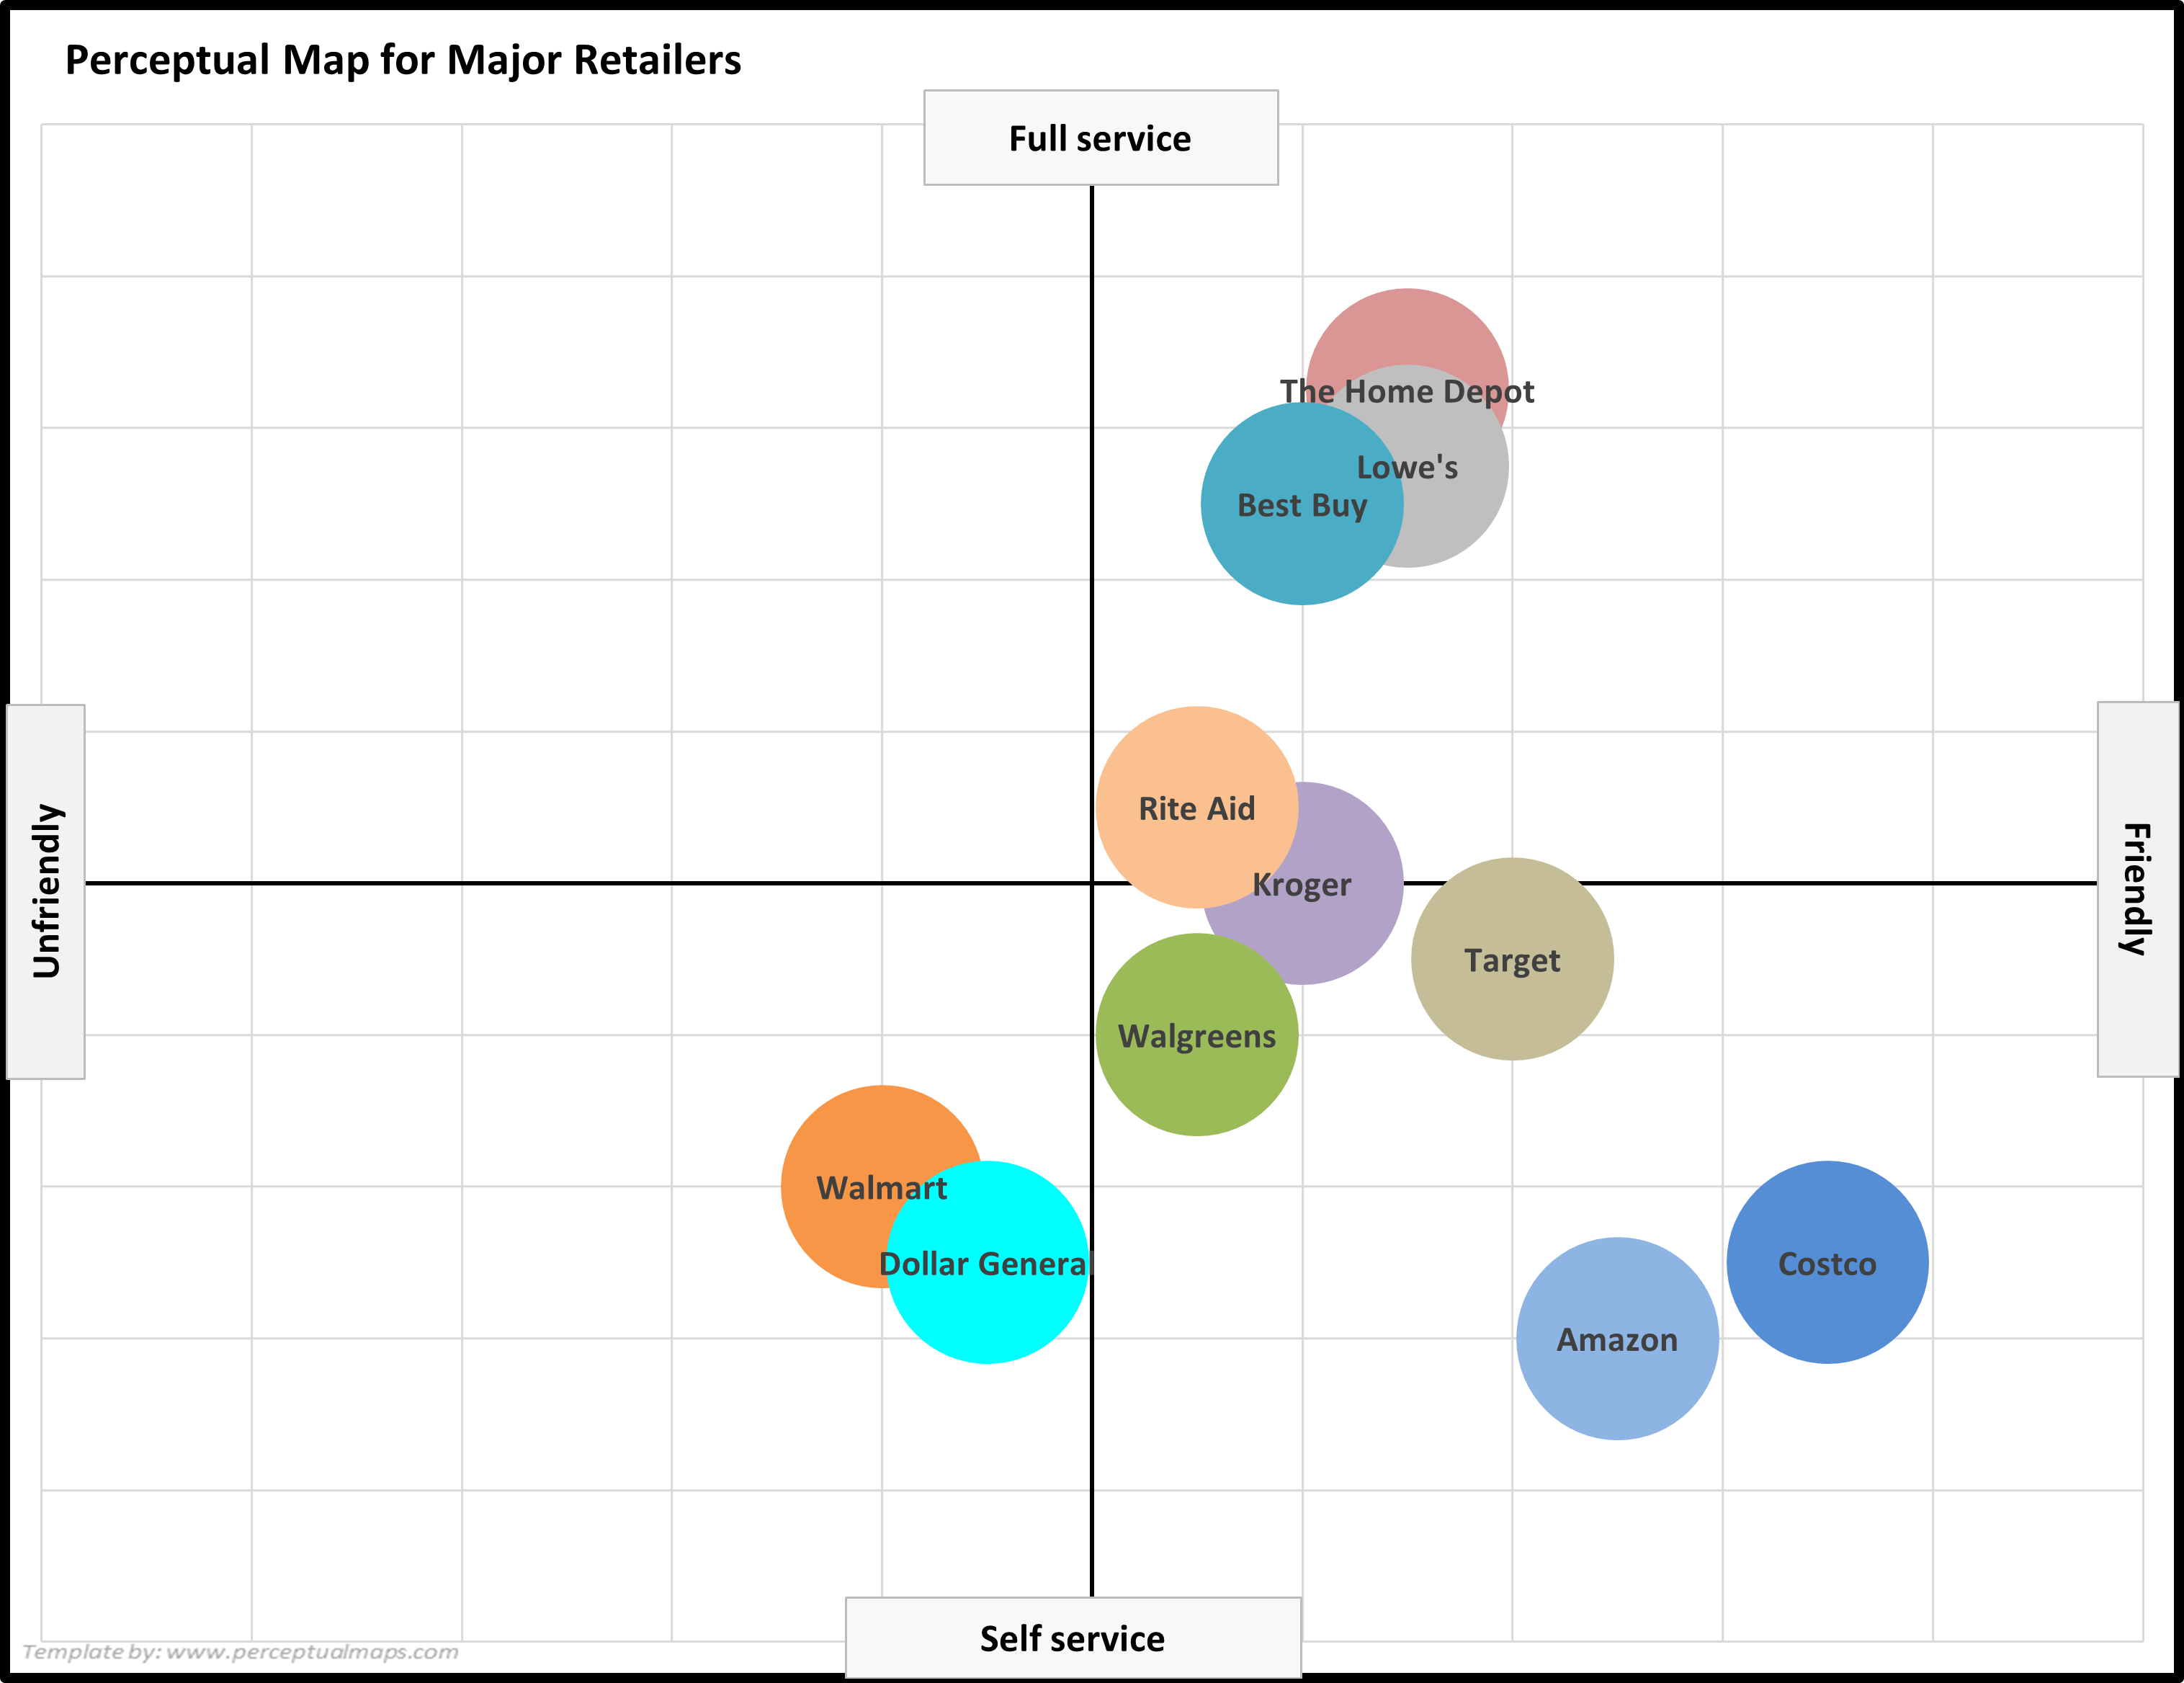
- PERCEPTUAL MAP 2 = Using the positioning attributes of:
- youthful to mature and uninspiring to inspiring
- youthful to mature and uninspiring to inspiring
Design Notes
Each of the example perceptual maps below have been created with the Excel perceptual map maker/template available for free download on Perceptual Maps 4 Marketing.
You can use this Excel perceptual map template in conjunction with the product/brand attribute ideas to design your own perceptual map (if required). Please refer to the list of tools and resources at the end of this post.
1st Example Perceptual Map for Retailers
Make your own map: Free Download of the Perceptual Map Template
Perceptual Map Scores Rationale and Discussion
For the product/brand attributes of: limited variety to lots of variety
- Walmart: 8.5 – Walmart offers a wide variety of products, including electronics, clothing, groceries, and home goods, although it may not have as extensive a selection as Amazon.
- Amazon: 9.0 – Amazon has an immense product variety, selling virtually everything from electronics to books, groceries, and more, making it the most diverse on this list.
- Kroger: 6.0 – Kroger is primarily focused on groceries but does offer a reasonable selection of general merchandise, such as household items, health and beauty products, and some electronics.
- Costco: 7.5 – Costco offers a broad range of products, including groceries, electronics, furniture, and more, but its selection is somewhat limited by its wholesale model and a focus on bulk items.
- Walgreens: 5.0 – Walgreens primarily focuses on health and beauty products, pharmaceuticals, and some general merchandise, but it doesn’t have the same variety as larger retailers.
- The Home Depot: 3.5 – The Home Depot specializes in home improvement and construction supplies, so it has a limited variety compared to more general retailers.
- Target: 7.5 – Target offers a good variety of products, including clothing, electronics, groceries, and home goods, but it may not have the same depth of selection as Amazon or Walmart.
- Lowe’s: 3.5 – Lowe’s, like The Home Depot, specializes in home improvement and construction supplies, so it has a limited variety compared to more general retailers.
- Rite Aid: 4.5 – Rite Aid focuses on pharmaceuticals, health and beauty products, and some general merchandise, but its product variety is limited compared to larger retailers.
- Best Buy: 3.0 – Best Buy specializes in electronics and appliances, so its product variety is limited compared to more general retailers.
- Dollar General: 5.5 – Dollar General offers a moderate variety of products, including groceries, household items, and health and beauty products, but its selection is less extensive than larger retailers.
For the product/brand attributes of: traditional to innovative
- Walmart: 5.6 – Walmart has implemented some innovative initiatives in recent years, such as online grocery pickup and in-store technology, but it still retains a traditional retail presence.
- Amazon: 9.0 – Amazon is highly innovative, consistently experimenting with new technologies and services, such as drone delivery, cashier-less stores, and voice-activated devices.
- Kroger: 5.0 – Kroger has made some innovative moves, like its partnership with Ocado for automated warehouses and online delivery, but it mainly operates as a traditional grocery retailer.
- Costco: 3.4 – Costco is known for its warehouse model and focus on bulk items, which is somewhat traditional, but it has made some strides in e-commerce and sustainability efforts.
- Walgreens: 3.7 – Walgreens has implemented some innovative solutions, such as in-store health clinics and digital initiatives, but it still largely operates as a traditional pharmacy and retail chain.
- The Home Depot: 4.7 – The Home Depot has made some innovative strides in e-commerce, mobile apps, and in-store technology, but its core business remains focused on traditional retail.
- Target: 6.0 – Target has been innovative in areas like store design, exclusive collaborations, and its focus on sustainability, but it still operates within a traditional retail framework.
- Lowe’s: 4.0 – Lowe’s has made efforts to innovate through e-commerce and in-store technology, but it remains largely a traditional home improvement and construction supply retailer.
- Rite Aid: 3.1 – Rite Aid has introduced some innovations, like in-store health clinics and digital initiatives, but it still primarily operates as a traditional pharmacy and retail chain.
- Best Buy: 6.6 – Best Buy has embraced innovation through its focus on technology and the integration of smart home products and services, as well as adapting its store format and online presence.
- Dollar General: 2.4 – Dollar General is mostly a traditional discount retailer, although it has made some efforts to expand its digital presence and offer more fresh produce in stores.
2nd Example Perceptual Map for Retailers
Make your own map: Free Download of the Perceptual Map Template
Perceptual Map Scores Rationale and Discussion
For the product/brand attributes of: unfriendly to friendly
- Walmart: 4.0 – Walmart’s focus on affordability sometimes results in less emphasis on personalized customer service, which may lead to perceptions of a less friendly environment.
- Amazon: 7.5 – Amazon’s commitment to customer satisfaction and seamless online shopping experience contribute to a friendly perception, although direct customer interactions are limited.
- Kroger: 6.0 – Kroger’s emphasis on quality groceries and community involvement promotes a friendly atmosphere, but experiences may vary depending on location and staff.
- Costco: 8.5 – Costco’s dedication to employee well-being and customer satisfaction fosters a friendly environment, as staff are more likely to be content and motivated.
- Walgreens: 5.5 – Walgreens’ focus on health and wellness products and its role as a trusted pharmacy create a generally friendly atmosphere, though experiences may differ by location.
- The Home Depot: 6.5 – The Home Depot’s expertise in home improvement and emphasis on customer service contribute to a friendly atmosphere, particularly for DIY enthusiasts.
- Target: 7.0 – Target’s combination of affordability, style, and community involvement make for a welcoming and friendly shopping experience for a wide range of customers.
- Lowe’s: 6.5 – Similar to The Home Depot, Lowe’s focus on home improvement and customer service fosters a friendly environment, particularly for those interested in home projects.
- Rite Aid: 5.5 – Rite Aid’s emphasis on health and wellness products, as well as its role as a trusted pharmacy, creates a generally friendly atmosphere, though experiences may differ by location.
- Best Buy: 6.0 – Best Buy’s focus on technology and electronics, combined with its commitment to customer service, promotes a friendly environment for tech enthusiasts.
- Dollar General: 4.5 – Dollar General’s emphasis on affordability and practicality may lead to varying levels of friendliness depending on location and staffing.
For the product/brand attributes of: self-service to full service
- Walmart: 3.0 – Walmart’s focus on affordability and wide product range results in a mix of self-service and some assistance from store associates, depending on the location.
- Amazon: 2.0 – Amazon’s online shopping experience is primarily self-service, although customer support is available to address any issues or inquiries.
- Kroger: 5.0 – Kroger offers a balance between self-service and full service, with staff available to assist customers in locating items and providing additional services such as deli counters.
- Costco: 2.5 – Costco’s warehouse model leans toward self-service, although employees are available to assist with locating items and answering questions.
- Walgreens: 4.0 – Walgreens provides a mix of self-service and full service, with pharmacy services and staff available for assistance, while customers can also browse items independently.
- The Home Depot: 8.25 – The Home Depot offers a more full-service approach, with knowledgeable staff available to provide expert advice and assistance for home improvement projects.
- Target: 4.5 – Target’s emphasis on affordability and style results in a blend of self-service and staff assistance, depending on the customer’s needs and the location.
- Lowe’s: 7.75 – Lowe’s provides a more full-service experience, with staff available to offer guidance and support for various home improvement tasks.
- Rite Aid: 5.5 – Rite Aid offers a balance between self-service and full service, with pharmacy services and staff assistance available alongside self-service browsing.
- Best Buy: 7.5 – Best Buy leans more toward full service, with knowledgeable staff available to help customers navigate the wide range of technology and electronics products.
- Dollar General: 2.5 – Dollar General’s focus on affordability and practicality results in a predominantly self-service experience, with staff available for assistance as needed.
More Perceptual Mapping Information and Resources
Reasons to Use Perceptual Mapping
List of Product and Brand Attributes Ideas
Working with Perceptual Maps
- Perceptual Maps: Best Practice
- Get the Most Out of Your Perceptual Maps
- Top 12 Tips for Analyzing Perceptual Maps
Other Perceptual Mapping Tools
- Make 100s of Perceptual Maps Really Fast
- When to Use an Overall Similarities (OS) Perceptual Map
- What are Joint Space Maps?
- What is a Multi-Dimensional Scaling (MDS) Perceptual Map?
- How to Make a Perceptual Map in Excel 365
- How to make a perceptual map in PowerPoint
- Different Types of Perceptual Maps
Perceptual Maps 4 Marketing
- The Home of the Free Perceptual Map Excel Template
- Downloaded over 100,000 times since 2013
- Always free, always will be
- Ideal tool for marketing students, analysts, and practitioners
Take me to the free download page: Free Download of the Perceptual Map Template