Contents
Example Perceptual Maps for Fast Food
Below you will find two different example perceptual maps for the fast food market.
Two variations of perceptual maps have been provided below (using different product and/or brand attributes), in order to give you a choice of the map that best suits your needs.
You should note that each mapping approach will “paint a different picture” of the market, which may help provide insight into the relative brand positioning strategies.
IMPORTANT NOTE: These example maps have been provided for educational purposes only and are estimates of brand positioning only, and should not be relied upon for decision-making. Perceptual maps used in marketing should always be based upon current and valid consumer image data.
Design Notes
Each of the example perceptual maps below have been created with the Excel perceptual map maker/template available for free download on Perceptual Maps 4 Marketing.
You can use this Excel perceptual map template in conjunction with the product/brand attribute ideas to design your own perceptual map (if required). Please refer to the list of tools and resources at the end of this post.
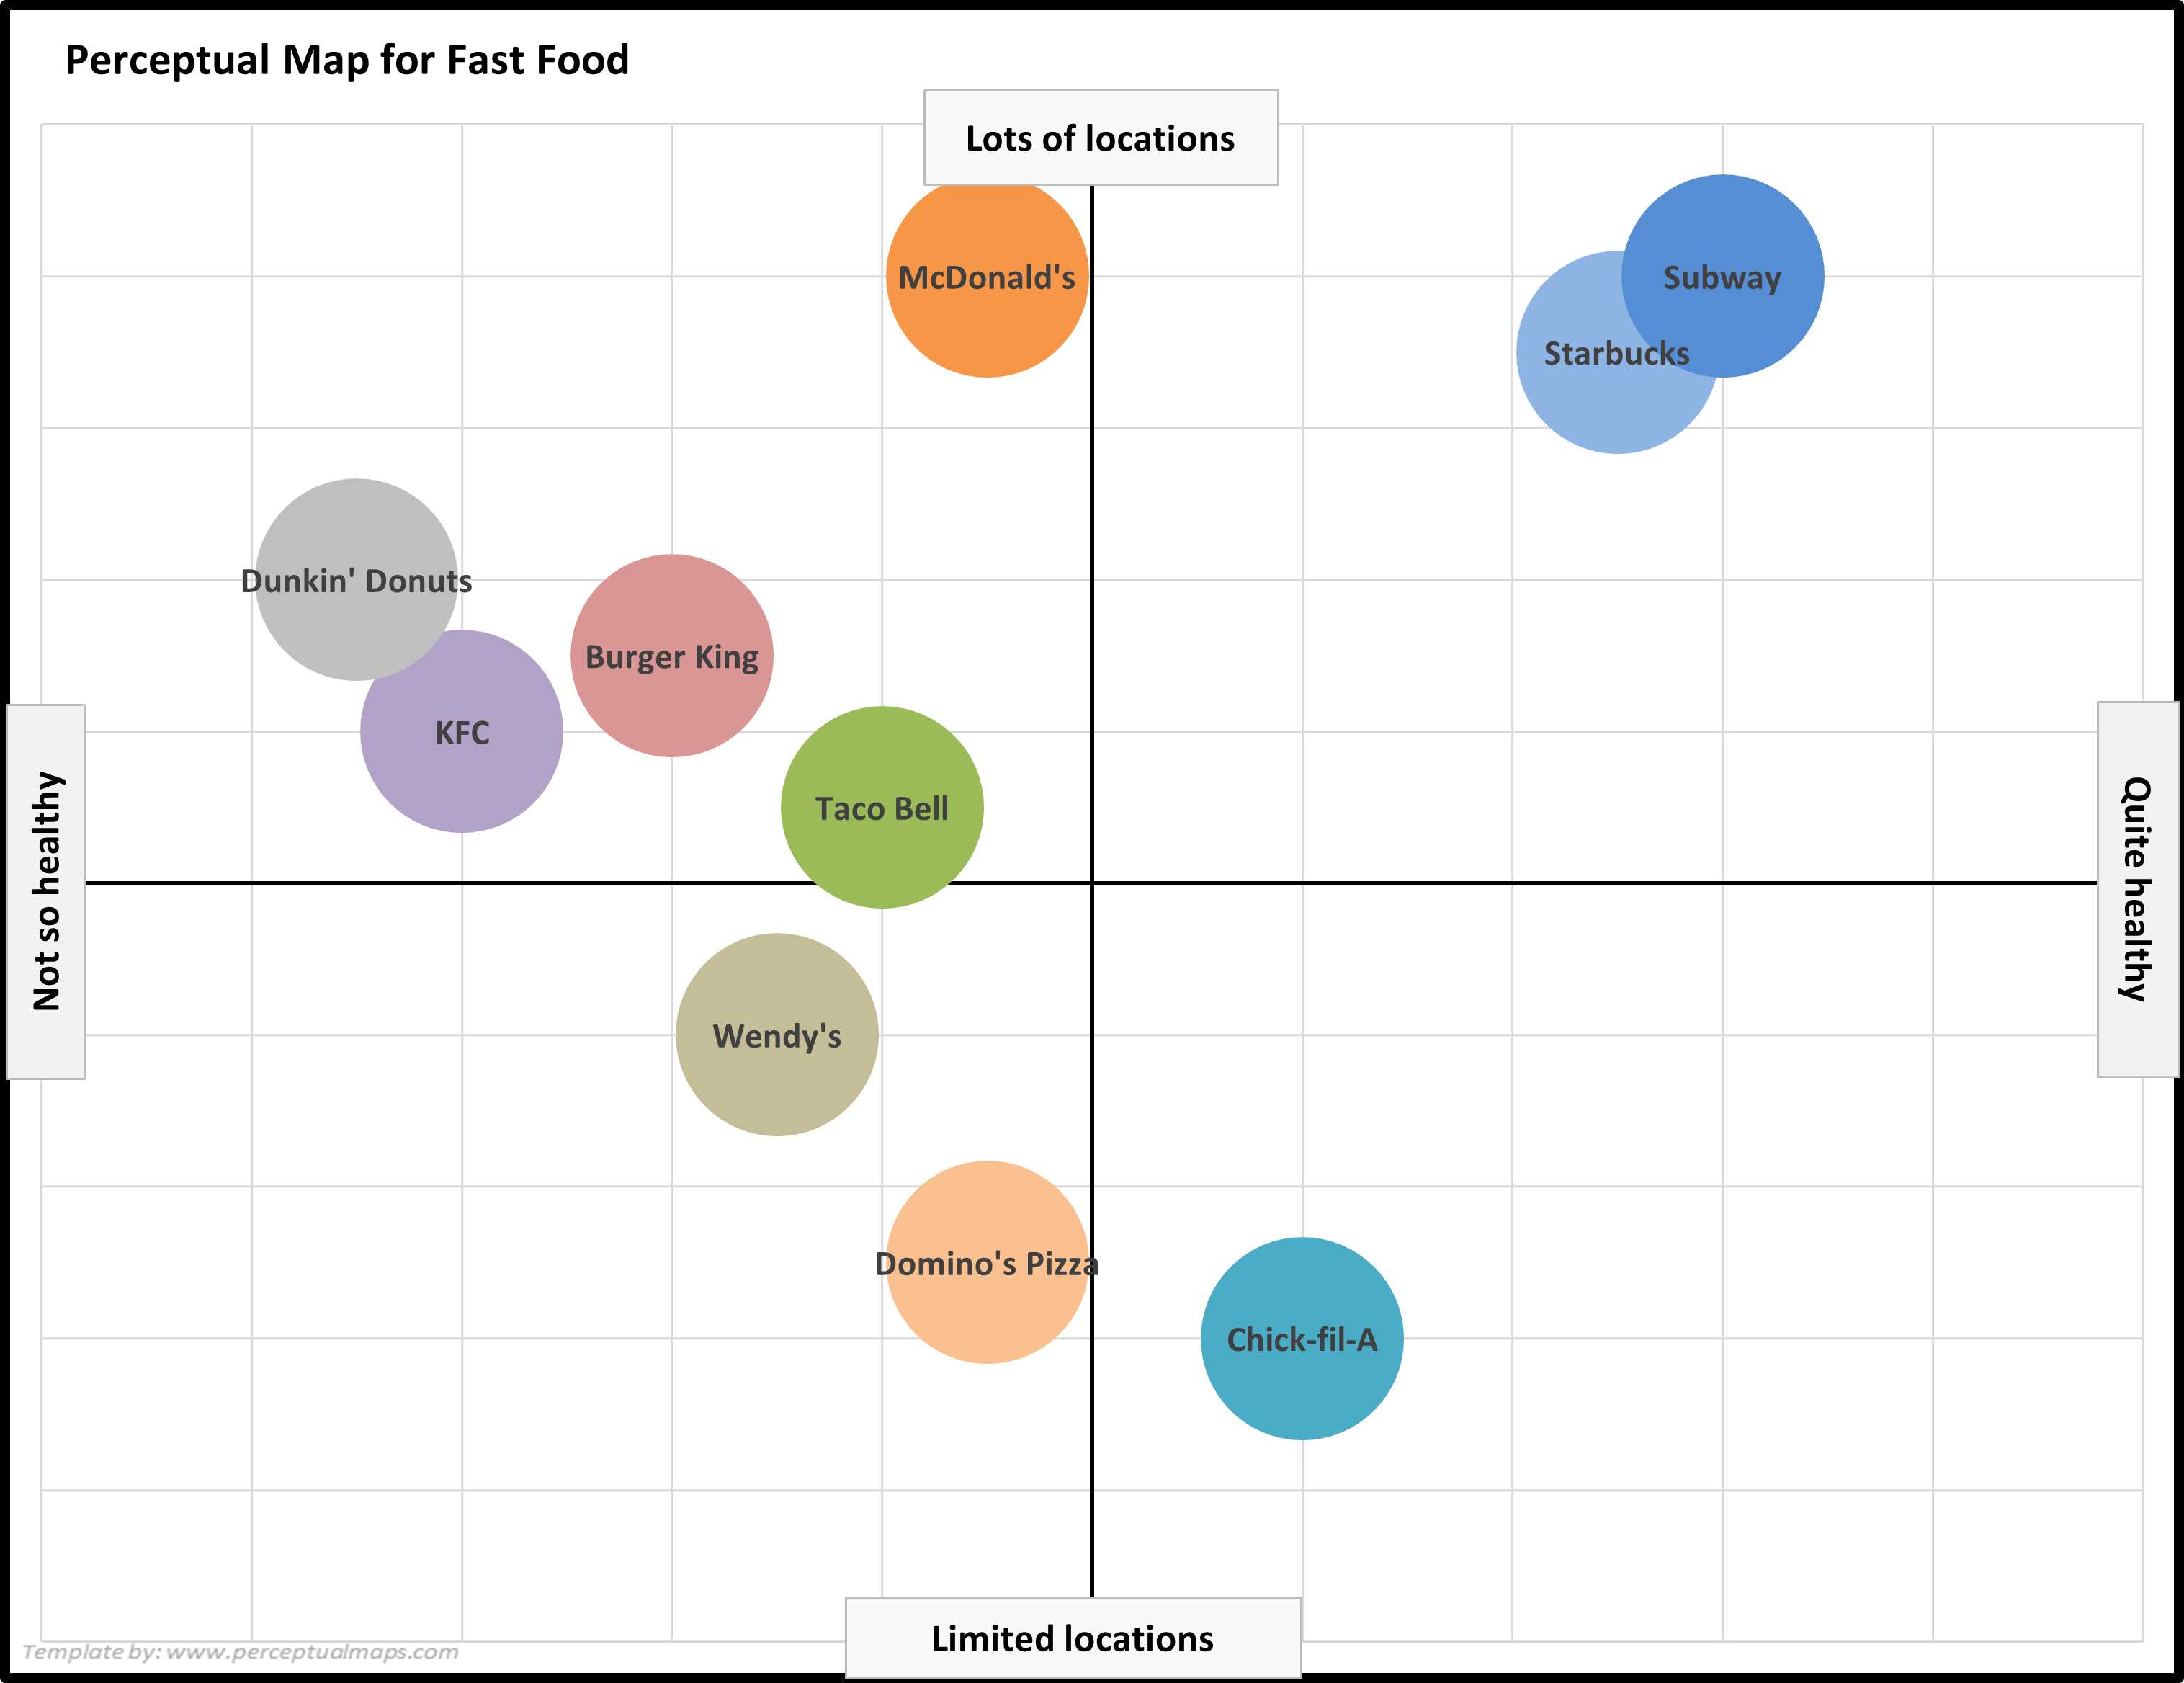
1st Example Perceptual Map for Fast Food
Want to design your own map? Take me to the free download page: Free Download of the Perceptual Map Template
Perceptual Map Scores Rationale and Discussion
For the product/brand attributes of: Not so healthy to Quite healthy
- McDonald’s: 4.5 – While traditionally high-calorie, high-fat menu items, they have broadened their menu offerings in recent years.
- Starbucks: 7.5 – Offers a variety of healthier options, including salads, sandwiches, and beverages.
- KFC: 2.0 – Primarily known for its fried chicken products, which are generally high in fat.
- Subway: 8.0 – Promotes customization of sandwiches and salads, allowing for healthier choices.
- Taco Bell: 4.0 – Mix of healthy and unhealthy options, with some lower-calorie offerings.
- Burger King: 3.0 – Predominantly serves high-calorie, high-fat burgers and fried foods.
- Wendy’s: 3.5 – Offers some healthier alternatives, but the menu is largely composed of high-calorie items.
- Dunkin’ Donuts: 1.5 – Primarily focused on sugary, high-calorie baked goods and beverages.
- Domino’s Pizza: 4.5 – Offers a variety of pizza options, but generally high in calories and saturated fat.
- Chick-fil-A: 6.0 – Provides some healthier options, such as grilled chicken, but still has a largely high-calorie menu.
Note: These are hypothetical ratings developed with the assistance of AI tools.
For the product/brand attributes of: Limited locations to Lots of locations
- McDonald’s: 9.0 – Possesses a vast number of locations nationwide, making it highly accessible.
- Starbucks: 8.5 – Boasts a substantial presence across the country with numerous outlets.
- KFC: 6.0 – Has a moderate number of locations, but less extensive than some competitors.
- Subway: 9.0 – Holds the largest number of locations among fast-food chains in the U.S.
- Taco Bell: 5.5 – Features a fair number of outlets, although not as widespread as some others.
- Burger King: 6.5 – Maintains a considerable presence, but not as extensive as top competitors.
- Wendy’s: 4.0 – Operates a relatively smaller number of locations compared to major rivals.
- Dunkin’ Donuts: 7.0 – Enjoys a strong presence, particularly in the Northeastern U.S.
- Domino’s Pizza: 2.5 – Fewer locations compared to most competitors, with a focus on delivery.
- Chick-fil-A: 2.0 – Limited locations, particularly due to being closed on Sundays and regional focus.
Note: These are hypothetical ratings developed with the assistance of AI tools.
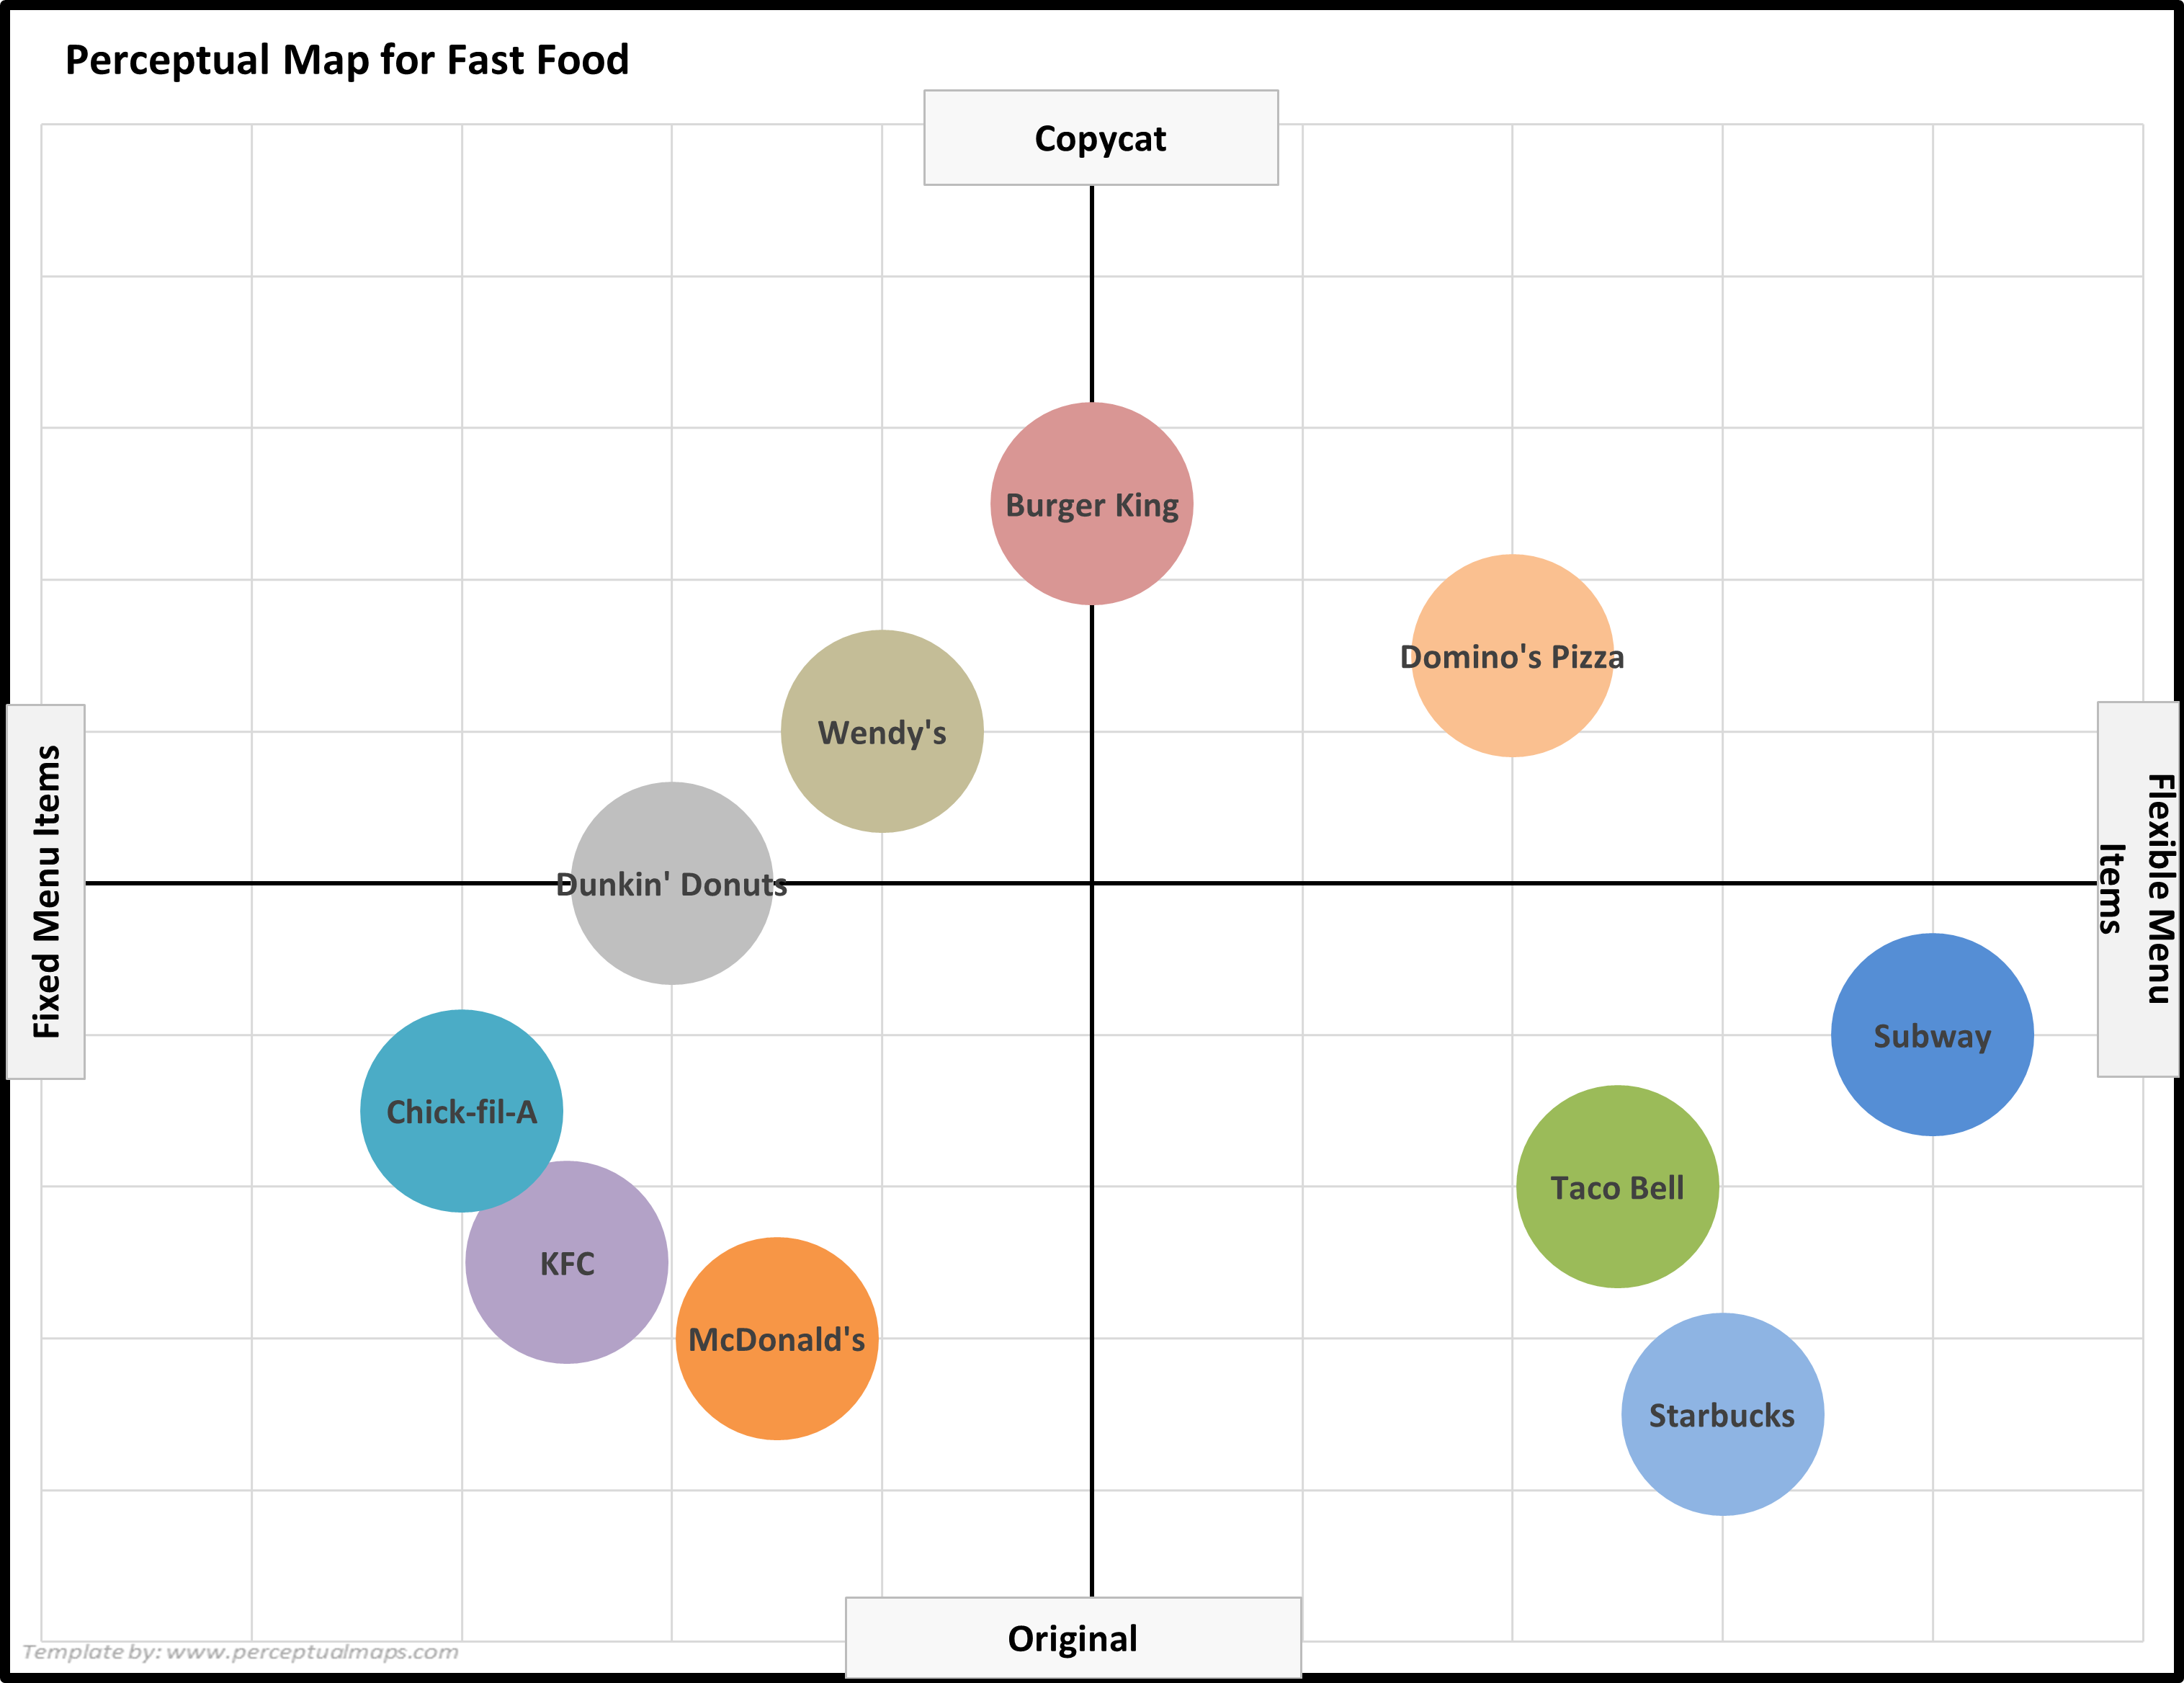
2nd Example Perceptual Map for Fast Food
Want to design your own map? Take me to the free download page: Free Download of the Perceptual Map Template
Perceptual Map Scores Rationale and Discussion
For the product/brand attributes of: Fixed menu items to Flexible menu items
- McDonald’s: 3.5 – Primarily offers fixed menu items, with limited customization options.
- Starbucks: 8.0 – Provides a high level of customization for beverages and a variety of food options.
- KFC: 2.5 – Largely focused on fixed menu items, with limited opportunities for customization.
- Subway: 9.0 – Highly flexible menu, enabling extensive customization of sandwiches and salads.
- Taco Bell: 7.5 – Offers a variety of customizable menu options and encourages creative combinations.
- Burger King: 5.0 – Allows some customization of burgers, but the core menu remains relatively fixed.
- Wendy’s: 4.0 – Primarily features fixed menu items, with a few opportunities for customization.
- Dunkin’ Donuts: 3.0 – Limited customization options, mainly focused on fixed menu items.
- Domino’s Pizza: 7.0 – Provides flexibility in pizza toppings, crusts, and sauces, but has a more fixed menu for other items.
- Chick-fil-A: 2.0 – Largely offers fixed menu items with minimal customization options.
Note: These are hypothetical ratings developed with the assistance of AI tools.
For the product/brand attributes of: Original to copycat
- McDonald’s: 2.0 – Widely regarded as an industry pioneer, setting many fast-food trends and standards.
- Starbucks: 1.5 – Considered a trailblazer in popularizing the coffeehouse culture and specialty beverages.
- KFC: 2.5 – Known for its original recipe and unique approach to fast-food fried chicken.
- Subway: 4.0 – Not the first sandwich chain, but popularized the “build-your-own” sandwich concept.
- Taco Bell: 3.0 – Introduced Mexican-inspired fast food to a broader market, with a unique menu and branding.
- Burger King: 7.5 – Often perceived as following in the footsteps of McDonald’s, with some similar menu items.
- Wendy’s: 6.0 – Offers a distinct menu and branding, but shares similarities with other burger chains.
- Dunkin’ Donuts: 5.0 – Originally focused on donuts, but expanded to compete with Starbucks in the coffee market.
- Domino’s Pizza: 6.5 – Entered the market after other pizza chains but distinguished itself with a focus on delivery.
- Chick-fil-A: 3.5 – Pioneered the fast-food chicken sandwich and established a distinctive brand identity.
Note: These are hypothetical ratings developed with the assistance of AI tools.
More Perceptual Mapping Information and Resources
Reasons to Use Perceptual Mapping
List of Product and Brand Attributes Ideas
Working with Perceptual Maps
- Perceptual Maps: Best Practice
- Get the Most Out of Your Perceptual Maps
- Top 12 Tips for Analyzing Perceptual Maps
Other Perceptual Mapping Tools
- Make 100s of Perceptual Maps Really Fast
- When to Use an Overall Similarities (OS) Perceptual Map
- What are Joint Space Maps?
- What is a Multi-Dimensional Scaling (MDS) Perceptual Map?
- How to Make a Perceptual Map in Excel 365
- How to make a perceptual map in PowerPoint
- Different Types of Perceptual Maps
Perceptual Maps 4 Marketing
- The Home of the Free Perceptual Map Excel Template
- Downloaded over 100,000 times since 2013
- Always free, always will be
- Ideal tool for marketing students, analysts, and practitioners
Take me to the free download page: Free Download of the Perceptual Map Template