In this article, I’m going to give an introduction to perceptual maps and how they can help marketers understand consumer perceptions of their brands.
Contents
Let’s Talk Perceptions and Perceptual Maps
To quick start with, we need to connect the words “perceptual” and “perceptions.”
In marketing, perceptions are very important. We need to understand how consumers understand our brand, their opinions, their overall assessment, their attitudes to various brands and products and features, and how they think.
What we’re trying to do is take a consumer’s mind and map it. What are the configurations of brands, the interconnections that they have in their brain? How do they think about these brands in combination?
Please note that you can review the following video or scroll down for the full article.
What is a Perceptual Map?
Perceptual maps are visual representations of how consumers perceive different brands within a product category.
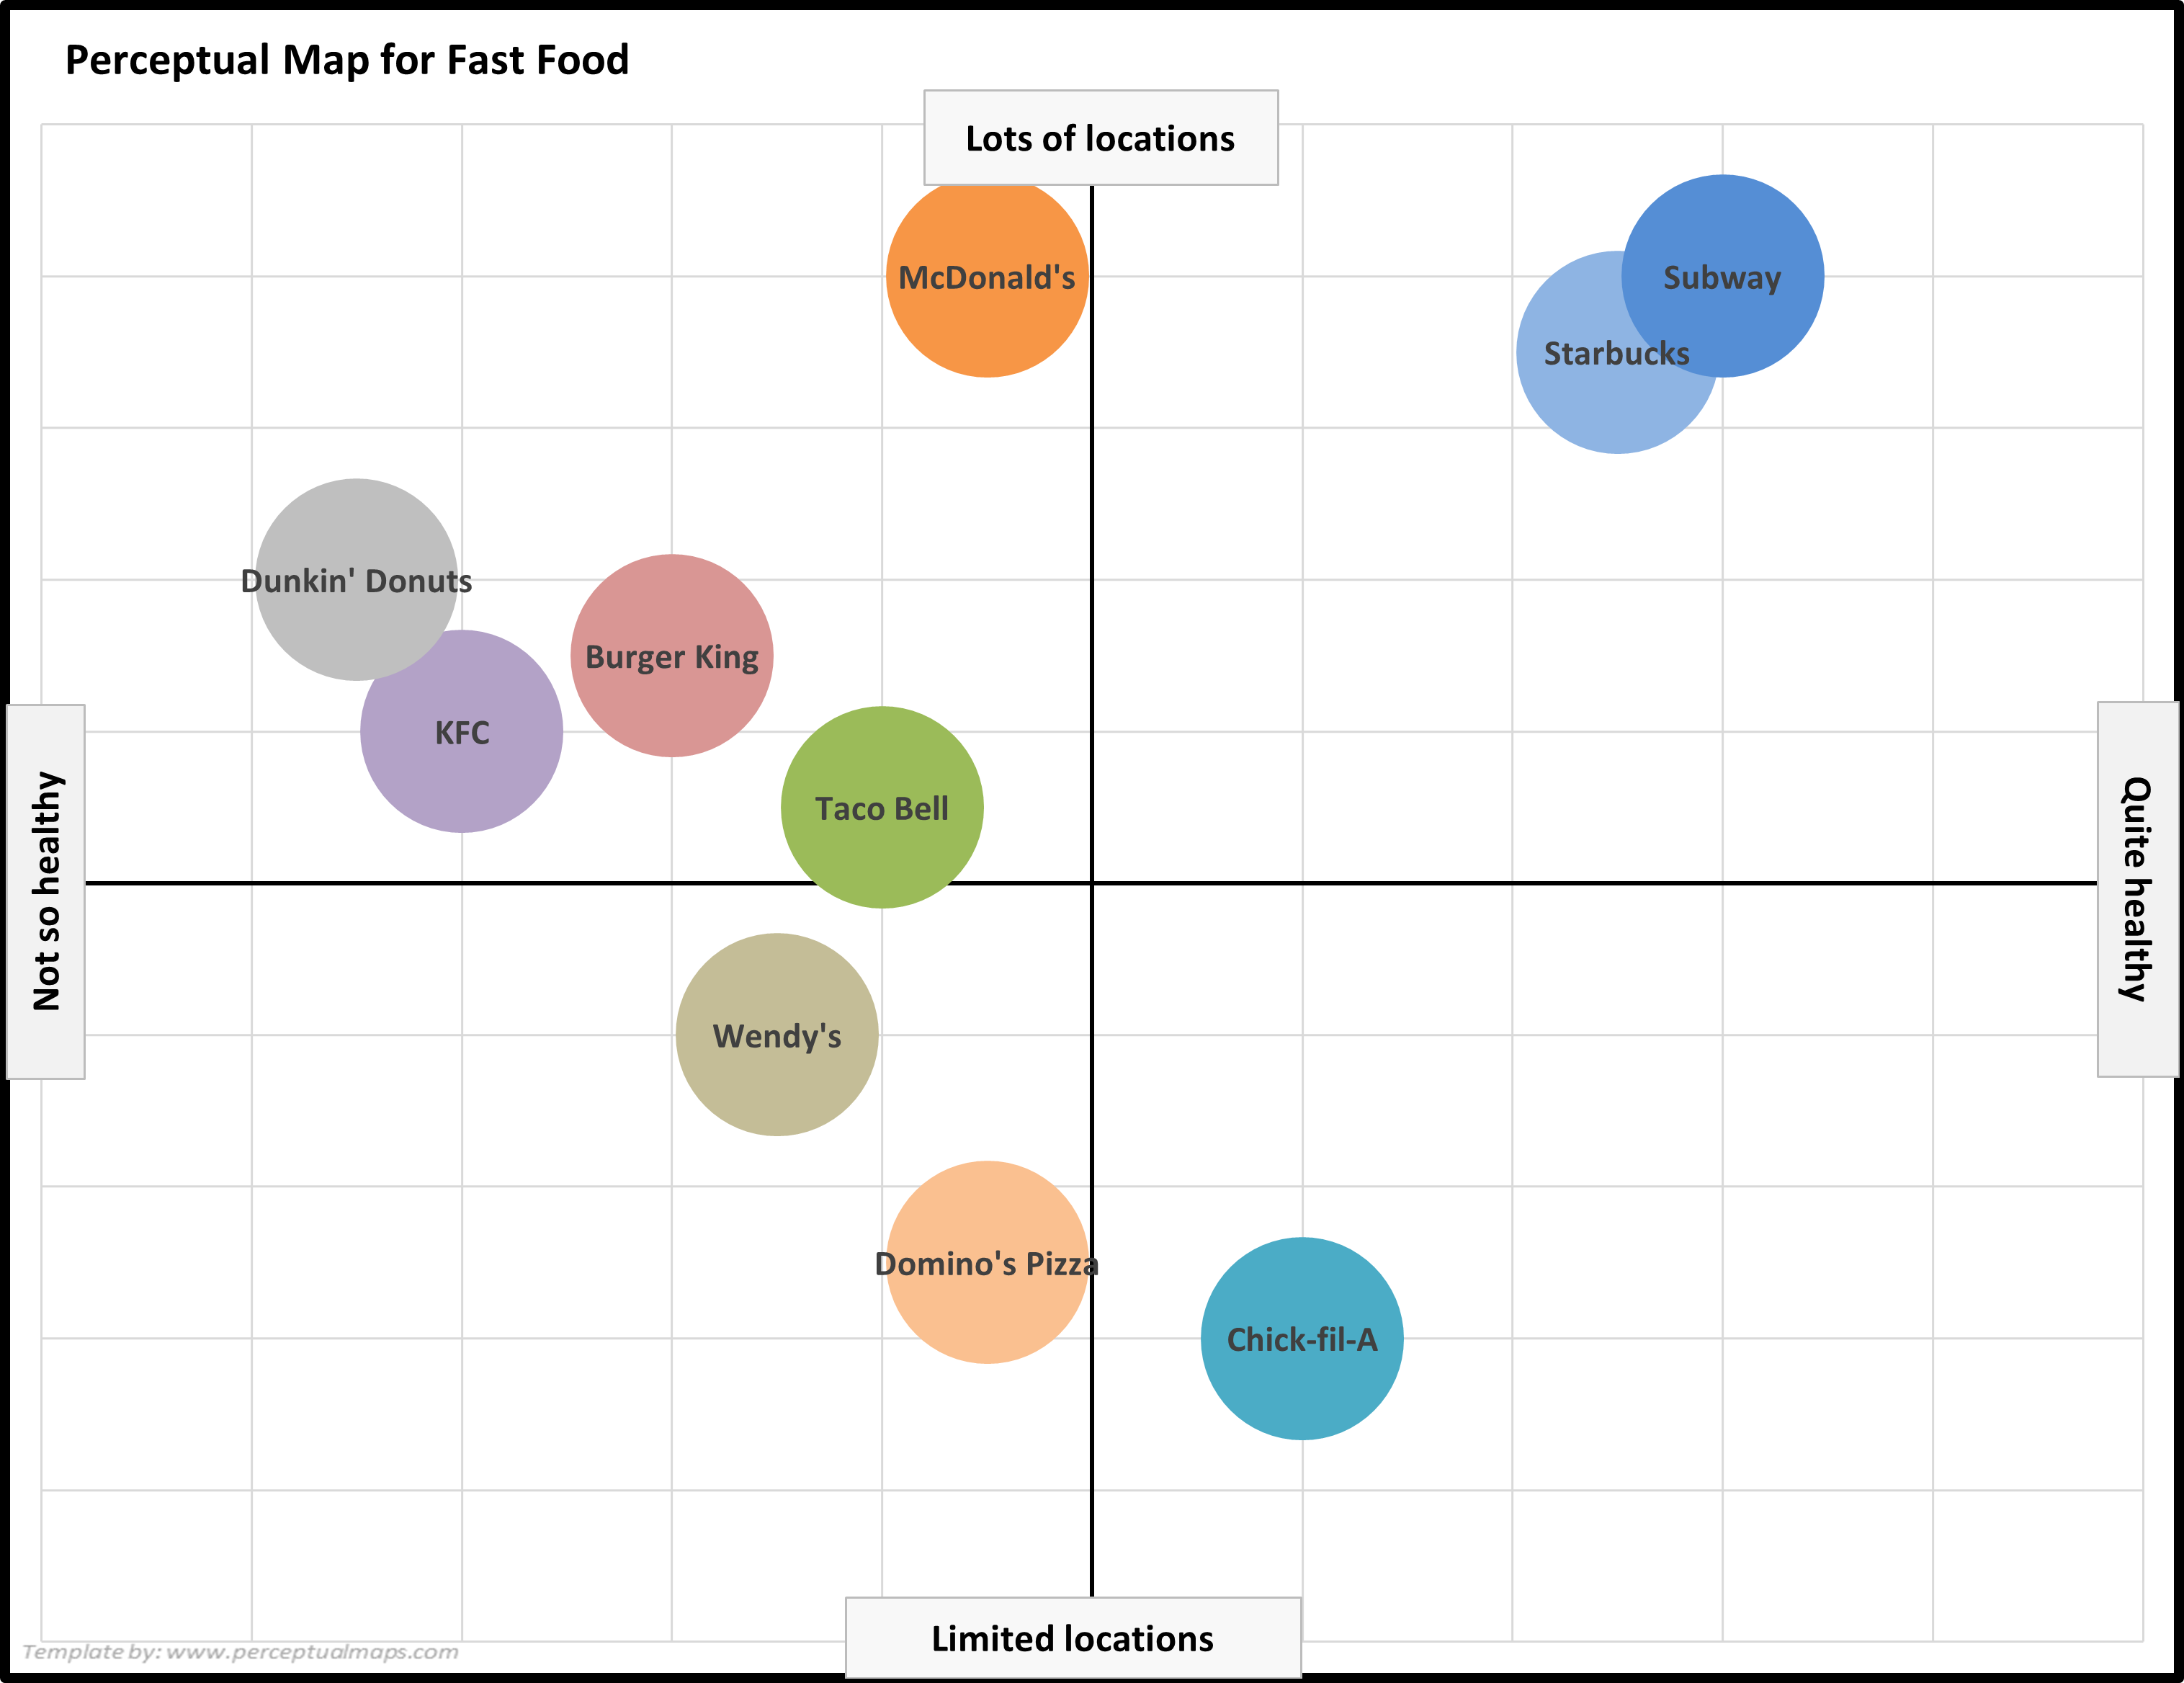
Below is a standard two-axis perceptual maps for the fast food market. It is designed to be a representation of what is in the mind of consumers (and/or a target market).
In this map the two attributes used are:
- Limited locations to lots of locations
- Not so healthy to quite healthy
The closer a brand is to the attribute – the more the brand is associated with that attribute. For example, McDonald’s is highly associated with ‘lots of locations’.
The above map was made using the: Free Download of the Perceptual Map Template
How are Perceptual Maps Created?
So, how are they constructed? Typically, we rely on market research survey data.
A company would go out and say, “We want to understand our brand positioning, we want to understand our image, so let’s do our research survey.”
They would put together various questions. They would not just include brand questions; they would include other questions as well.
In the brand image part of the questionnaire, the respondents would be given a scale, something like:
- On a scale of one to seven, where 1 is boring and 7 is exciting, how would you rate each brand?
- How would you rate Brand A on that scale, then Brand B, then Brand C (etc.)?
You should note that the attribute choices presented to respondents are that there are always opposites (such as boring to exciting) so they force the consumer to make a decision.
Once we’ve got all that data, we collate it all up and we average it out for various target markets or various niche markets we want to look at, and we have an average score for each brand for each question. This resulting data is then used to plot each brand’s position on a two-axis perceptual map.
How Do We Use Perceptual Maps?
Once we have plotted the data points for each brand on the perceptual map, we can then analyze the positioning of the brands relative to one another.
This allows us to:
- identify gaps in the market,
- areas where there may be potential opportunities for new product development, or
- areas where the brand could potentially reposition itself to better align with consumer perceptions.
For more information, please review: Top 12 Tips for Analyzing Perceptual Maps
Other Tools for Creating Perceptual Maps
In addition to the standard two-axis perceptual map, more advanced techniques, such as multi-dimensional scaling (MDS) or correspondence analysis, can be employed to create perceptual maps with multiple dimensions.
These techniques can help to uncover deeper and more nuanced insights into consumer perceptions of the brands and their product offerings. However, these approaches are more complex and require specialized knowledge and software to implement.
For more information, please review:
- About Multidimensional Perceptual Maps
- MDS Maps vs Correspondence Analysis Maps
- Different Types of Perceptual Maps
Consumer Data in Needed for a Perceptual Map
A good perceptual map is only as accurate as the data collected from the market research survey. Therefore, it’s crucial to ensure that the survey is well-designed, comprehensive, and representative of the target market.
The attributes used to create the perceptual map should also be relevant to the specific product category and target market and be easily understood by the respondents.
For more information, please review:
- Choosing Attributes for a Perceptual Map
- Brand Attributes Ideas for Perceptual Maps
- What is a Determinant Attribute?
The Wrap-Up
Perceptual maps are a valuable tool for marketers to visualize and understand the positioning of their brands relative to competitors within a specific market.
By examining the data points on the perceptual map, we can identify potential opportunities for growth or repositioning, as well as evaluate the effectiveness of their marketing strategies in aligning the brand image with consumer perceptions.
To maximize the value of the perceptual map, it is essential to ensure that the market research survey data is accurate, comprehensive, and representative of the target market, and that the chosen attributes are relevant and meaningful to the consumers.
More Perceptual Mapping Information and Resources
Reasons to Use Perceptual Mapping
List of Product and Brand Attributes Ideas
Working with Perceptual Maps
- Perceptual Maps: Best Practice
- Get the Most Out of Your Perceptual Maps
- Top 12 Tips for Analyzing Perceptual Maps
Other Perceptual Mapping Tools
- Make 100s of Perceptual Maps Really Fast
- When to Use an Overall Similarities (OS) Perceptual Map
- What are Joint Space Maps?
- What is a Multi-Dimensional Scaling (MDS) Perceptual Map?
- How to Make a Perceptual Map in Excel 365
- How to make a perceptual map in PowerPoint
- Different Types of Perceptual Maps