NOTE: Please scroll down for the multi-dimensional scaled (MDS) perceptual map template, or keep reading for an introduction to MDS mapping for marketing and consumer perceptions.
Contents
Why Use Multi-Attribute Perceptual Maps?
With multi-attribute maps, commonly refereed as multi-dimensional scaled perceptual maps, or MDS for short, we are using more than two brand/product attributes on the same perceptual map.
So why would we want to make a MDS maps? Here are some key reasons:
MDS Maps Provide More Insight into the Marketplace
With multi-attribute perceptual maps, you are able to map many product attributes AND brands at the same time. This is achieved through a statistical process known as multi-dimensional scaling (MDS) or sometimes produced by correspondence analysis. By adding more than two attributes to a perceptual map, a marketer is better able to understand:
- How consumers perceive the mix of attributes offered by the brands in the market,
- How these attributes are interrelated in the minds of the consumer,
- How similar are the various competing brands,
- Which brands are most strongly associated with particular attributes, and
- What are the competitive sets in the market.
Traditionally, multi-dimensional scaling (MDS) to create a multi-attribute perceptual map required access to a statistical package (such as SPSS) or the purchase of an additional program to help Excel run the analysis (such as XLSTAT).
MDS Maps are More Reflective of the Marketplace
Most perceptual or positioning maps are simply constructed using two product attributes (click for examples of attributes to use in a map), commonly referred to as determinant attributes. While this is highly effective as a teaching technique for marketing students at the university-level, it is sometimes a very limited or restrictive approach to thinking about how consumers make decisions in real-life.
By constructing a perceptual map with only two product attributes, the marketing team is making the assumption that the average consumer in the target market makes their purchase decision based on these two attributes alone. While that may sometimes occur in a low-involvement purchase decision, it is unlikely to be the case in most consumer’s selections between competing products and brands.
Therefore, it is usually important and far more reflective of real-life purchasing decisions, to present a perceptual map that uses multiple attributes. In this case, what is known as a multi-attribute perceptual map.
Typically, to create a multi-attribute perceptual map, the marketing team will need to conduct an image or positioning survey with consumers in their target markets. Then using the above free Excel template, a combined perceptual map showing the various competing brands against a range of decision attributes can be shown.
Companies that have access to larger budgets and hire professional marketing research firms will generally produce multi-attribute based perceptual maps. However, it is quite easy to construct a perceptual map in this format using the above free Excel perceptual mapping template.
Find out more about MDS mapping:
- What is a Multi-Dimensional Scaling (MDS) Perceptual Map?
- Video Guide to Multi-dimensional Scaled (MDS) Perceptual Maps
- How to Analyze Perceptual Maps
- How to interpret a multi-attribute perceptual map
- MDS Maps vs Correspondence Analysis Maps
Example of a Multi-Attribute Perceptual Map
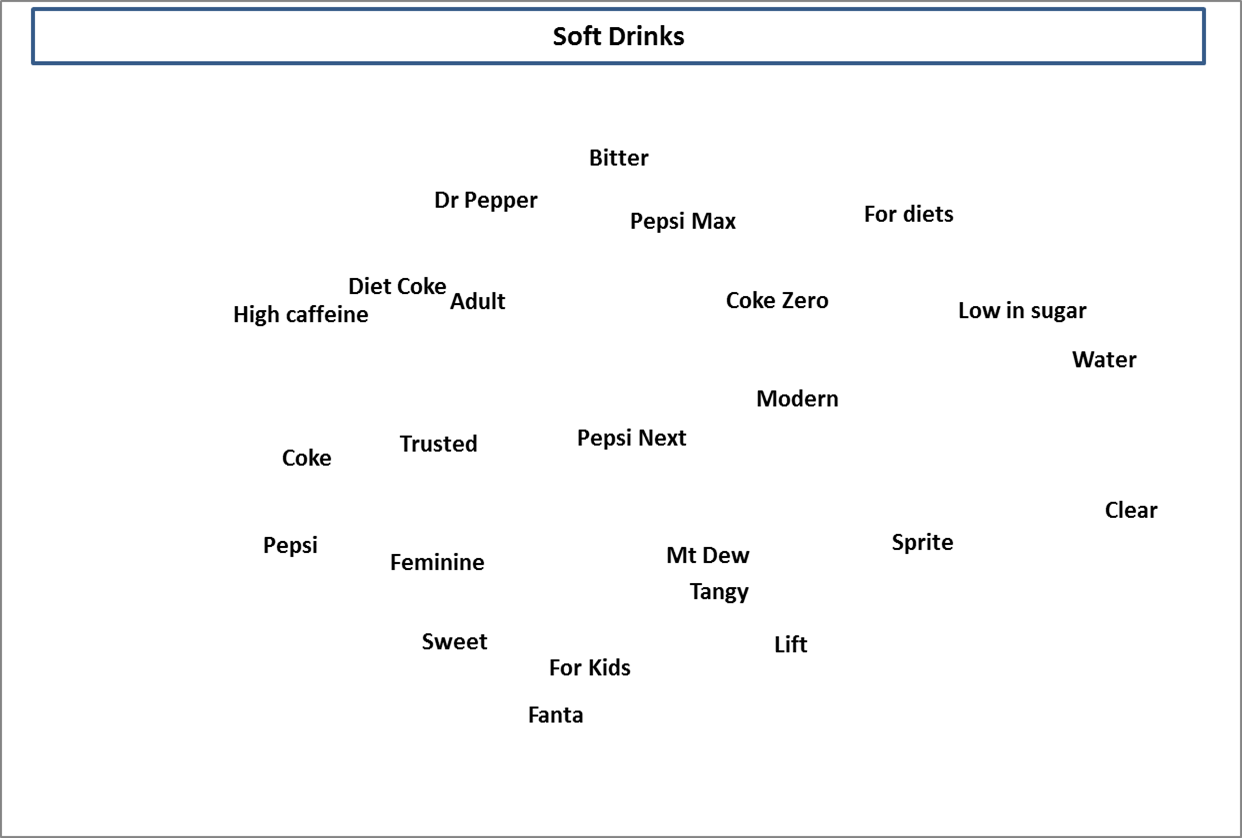
The following perceptual map for the soft drink market has been constructed by using the free Excel spreadsheet above.
As you can see, various soft drink brands, such as Coke and Pepsi, have been mapped alongside five different product and image attributes. In this case, the attributes used are: fun, traditional, sweet, energetic and young. These product and brand attributes have been highlighted in blue on the perceptual map.
To better understand the consumer’s perceptions in this market, a number of various brand image and actual product features have been used in combination on the same perceptual map.
The goal of the marketing team here is to create a more complete understanding of how consumers perceive the various competitors in the soft drink market, by consider multiple attributes in the purchase decision.
Download the Excel template to Create a Multi-attribute Perceptual Map
- Click on this link to download the free multi perceptual map template
Note: You will need to ‘enable macros’ after you open the spreadsheet.) (Requires Excel 2010 or later to run the macro. And also please review: Free Template Terms of Use
The above multi-attribute perceptual map Excel templates allow you to map up to 12 brands and up 12 attributes at the same time on the same perceptual map.
There are clear steps and instructions outlined within the spreadsheet itself, which you should follow. You will need to ‘enable macros’ when you open the file in order for the analysis to run. Or you can view the YouTube video below…
If you need greater capacity than the free mapping tool, then please review: Premium MDS Mapping Template
How to Use the Free MDS Tool Video
How to Use the Premium MDS Tool Video
Find out more about the premium MDS Excel mapping template: Premium MDS Mapping Template