Contents
What are Multi-dimensional Scaled (MDS) Perceptual Maps?
Multi-attribute perceptual maps (or MDS maps, or multi-dimensional scaled maps) show multiple brands and multiple product attributes at the same time.
They appear more complicated than the basic two dimensional perceptual maps that are typically taught in an introductory marketing class. However, once you know how to interpret a multi-attribute perceptual map you will find that they are more helpful and insight than the basic mapping technique.
- Want the free MDS template? Go to the download page for the free Excel template
Please review the following videos, or scroll don for the full article on how to interpret a multi-dimensional scaled perceptual map…
Interpreting a Multi-dimensional (multi-attribute) Perceptual Map
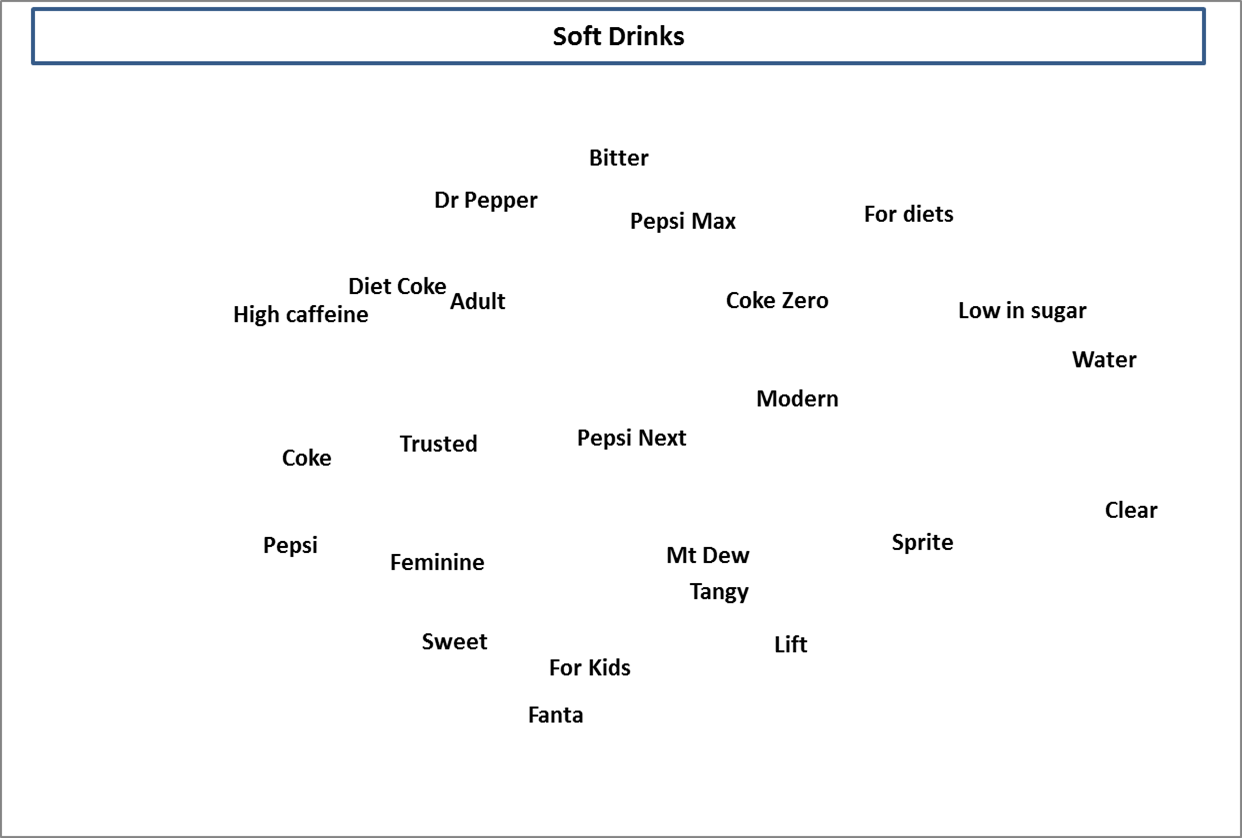
Here is a multi-attribute MDS perceptual map that has been constructed by the free Excel template available on this site (see link above).
Review the map first, and then scroll down to see how this map can be analyzed and interpreted. While this may look complex at first, there is a lot of information that can be deduced from a MDS map.
Please keep in mind that this overall example is so marketing students can get the sense of how to interpret a multi-dimensional perceptual map and make not fully reflect consumers’ perceptions at a particular point in time or for a specific country.
Firstly, What Does the Map Show Us?
This MDS mapping example is for soda/soft drink brands. On the map there are 12 brands AND 12 attributes plotted at the same time, which is quite different from the traditional two-attribute matrix style perceptual maps that we usually see in marketing and strategy textbooks.
What you should notice straight away…
There are No Axes on the Map
You should note that there are no axes on this map. There is NO guidance that tells how/why the brands are positioned in this structure in the consumer’s minds. This occurs because there are multiple attributes, making the construction of axes dependent upon the relationships between attributes, as we will discuss below.
Identifying (or uncovering) how/why the brands fall this way (relative to the attributes) is the role of the marketing analyst. They will need to logically connect the possible in-market relationships and draw in the underlying market dimensions.
We Can Read It Like a Geographic Map
The best way to read a MDS map is to think of it like a map that you would have in an atlas or on Google Maps. Are the points close together or far apart?
Points close together – whether they are brands or product attributes – are interrelated in the perceptions of the consumers. And points far apart are perceived as opposite or quite distinct.
What you need to look for is the distance between the attributes themselves, between the brands and between the brands and the attributes.
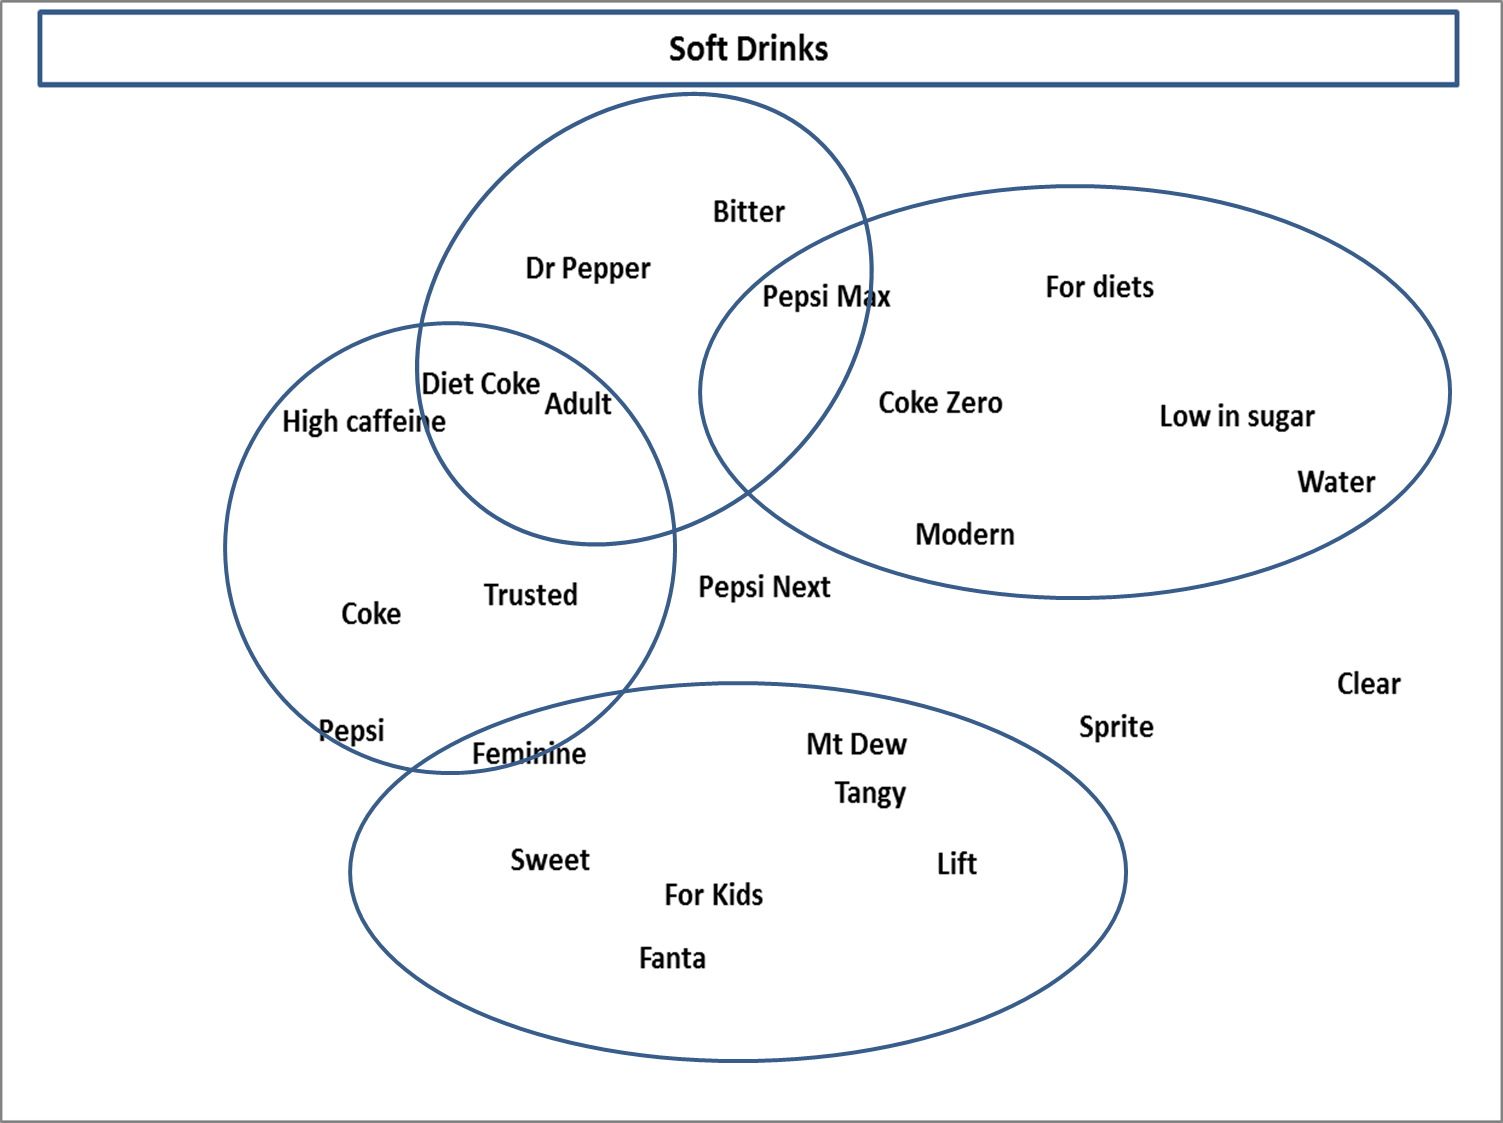
Analysis: Look for Clusters of Brands and Attributes
Here is the same multi-attribute perceptual map, but this time a series of circles have been added to highlight some of the key points from the map. Underneath the map a list of findings that a marketing analyst could make based upon this perceptual map.
Key Findings from the MDS Map (and some insights)
- There appears to be clear competitive sets within the market (e.g. Coke and Pepsi). We can tell this because these brands are positioned relatively close to each other on the map.
- The direct competitor sets are:
- Mt Dew, Lift, Fanta
- Coke Zero, Pepsi Max
- Coke, Pepsi
- Diet Coke, Dr Pepper, Pepsi Max
- You should note that Pepsi Max has been placed into two competitive sets – this would not be uncommon – and different marketing strategies would be required for each set of competitors
- Most brands have clear association with a few attributes. Again we can tell this because these brands sit quite close to these particular product attributes.
- When a brand is close to an attribute, without strong competition, then these are “owned attributes”
- In a competitive market, owned attributes would be relatively rare
- Some of the owned attributes from this map are:
- Fanta – For Kids and Sweet
- Mt Dew – Tangy
- Sprite – Clear
- But most of the brands are competing for attributes = these are known as “shared attributes”
- Some of the owned attributes from this map are:
- Bitter = Pepsi Max and Dr Pepper
- For diets = Water, Pepsi Max, Coke Zero
- Some brands do not have overly strong associations with product attributes – as they do not map close to any particular attribute. An example on this MDS is Pepsi Next.
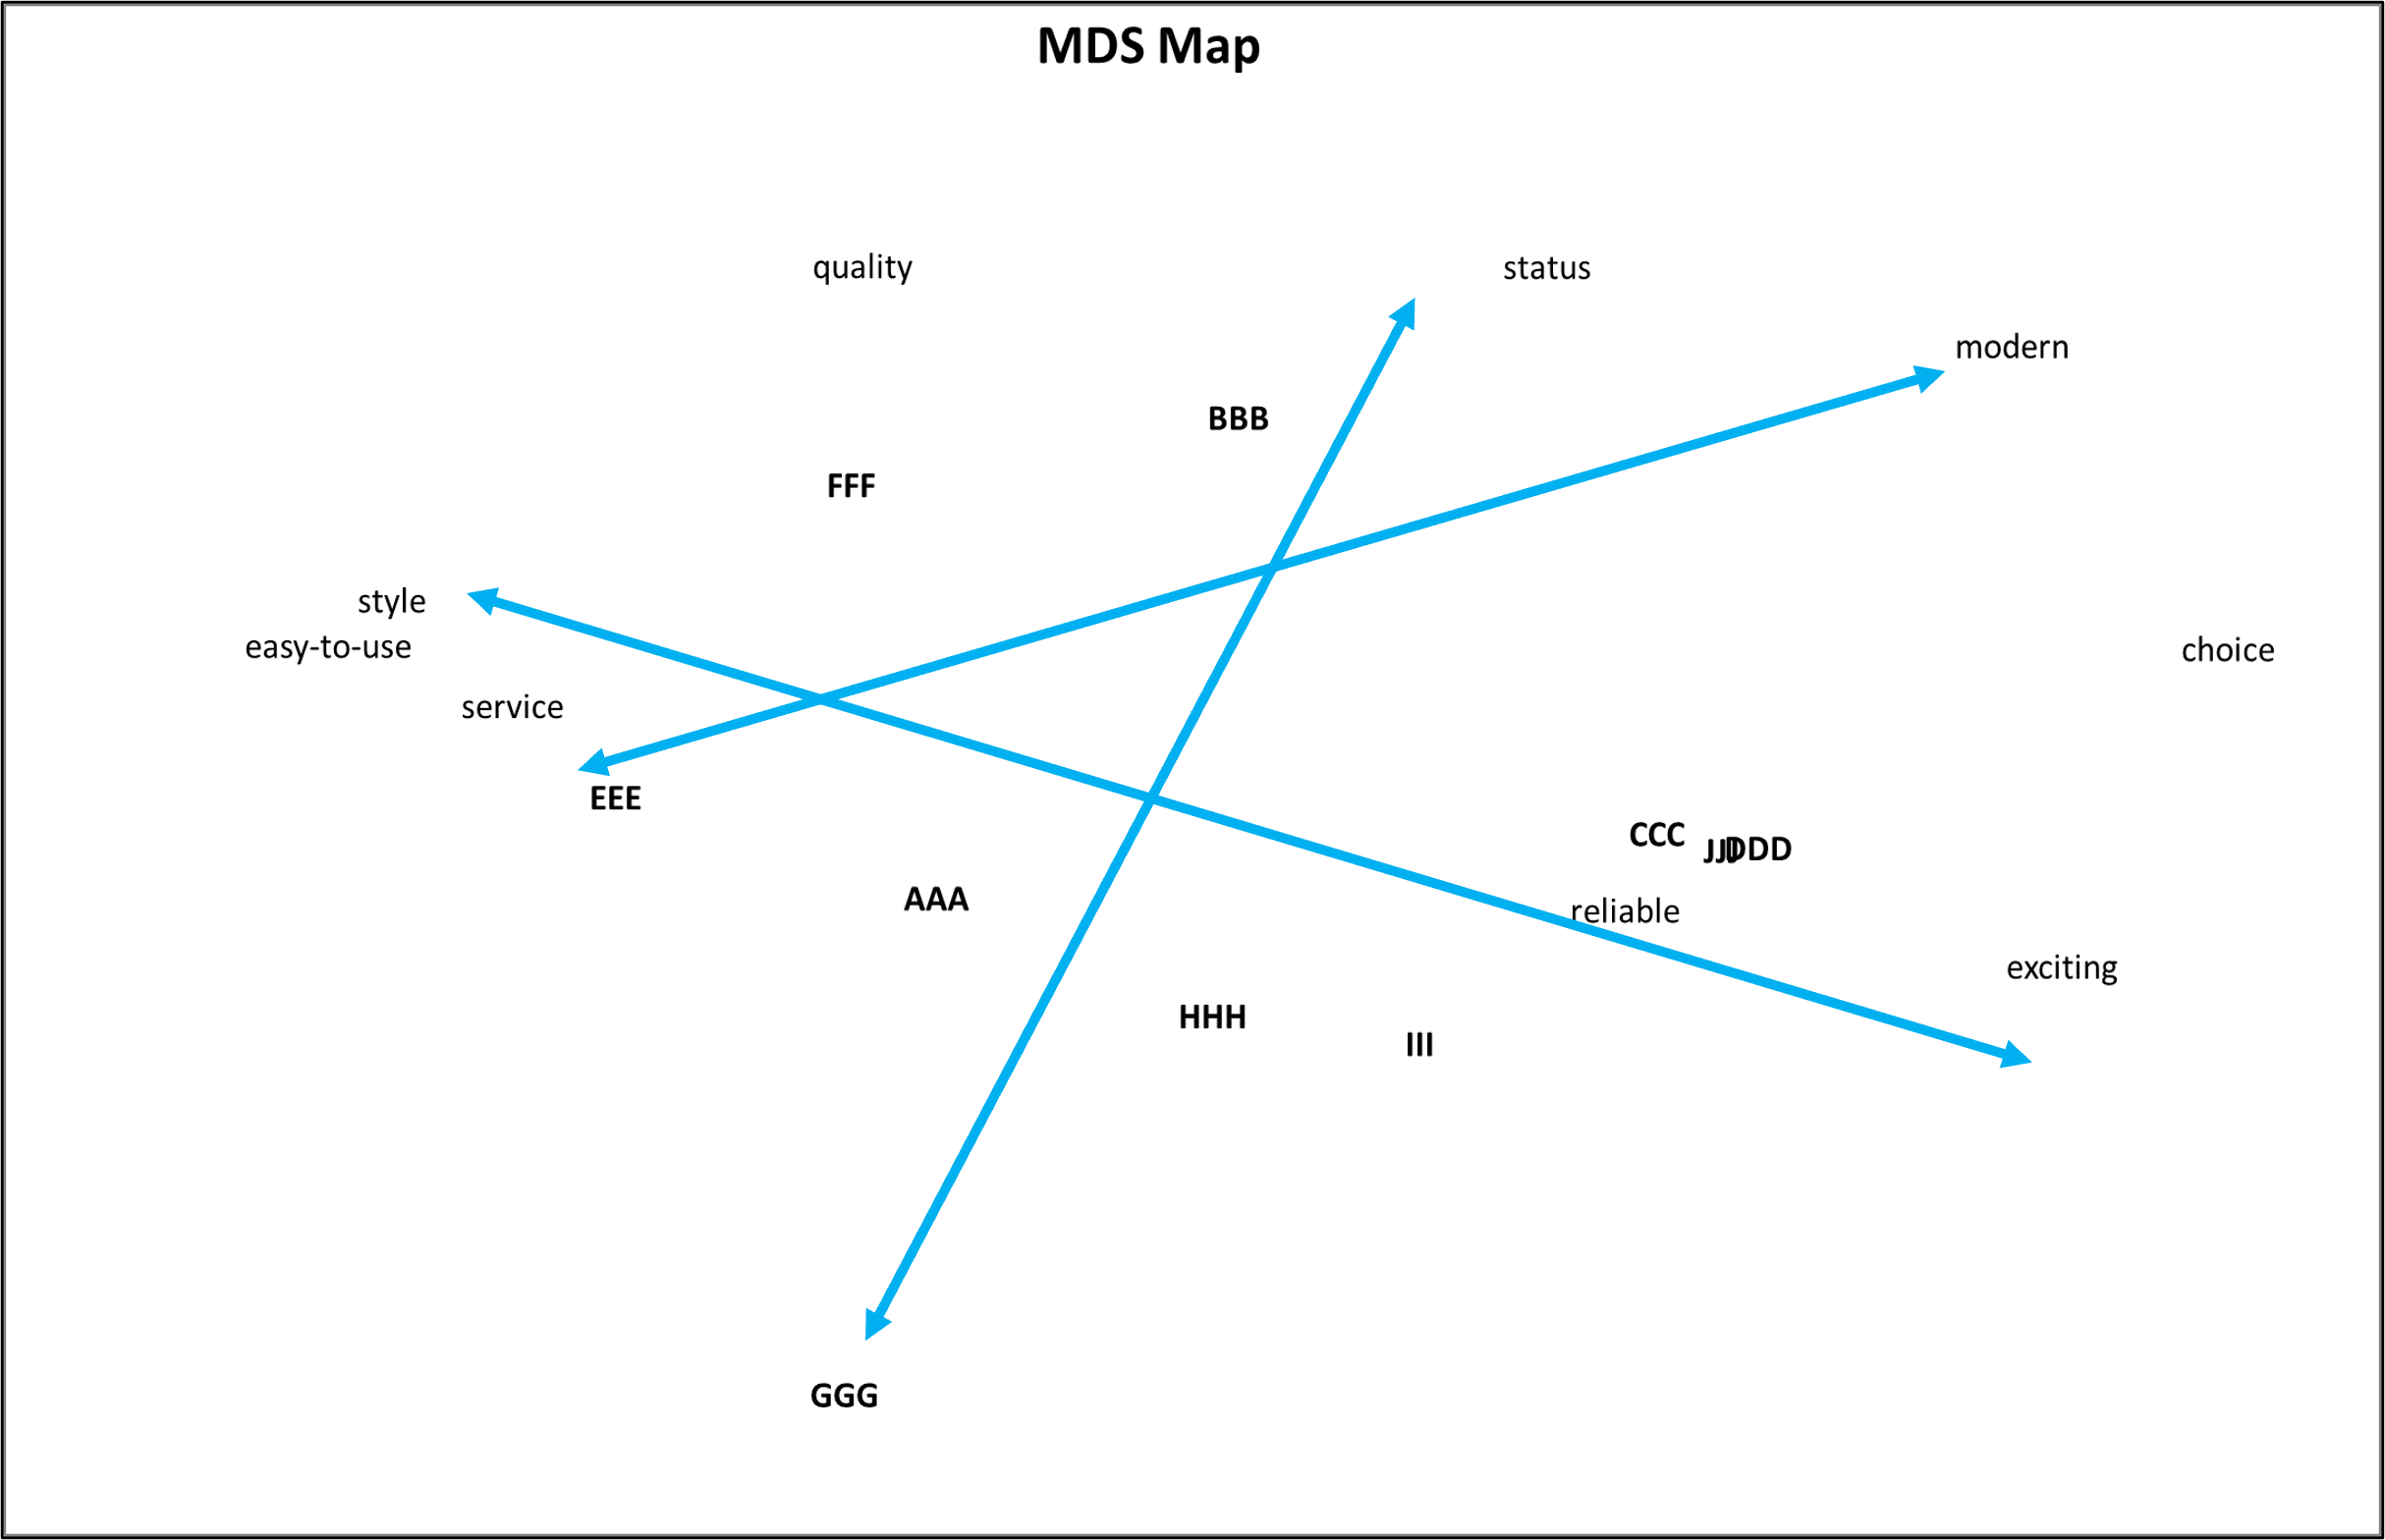
Analysis: Look for Directions and Relationships of Brands and Attributes
The next important analytical approach is to examine the relationship between the brands and attributes – which we can review from this next example MDS perceptual map.
What you can see if that there are arrows drawn onto this map. They are NOT automatic, but would be determined and identified by the marketing analyst.
In the map, it becomes evident that consumers perceive differences between product attributes. For example, ‘service and style’ is considered the opposite to ‘modern’. While ‘easy to use and style’ is perceived as quite different to ‘exciting and reliable’.
This is very helpful information as it guides us (as marketers) to how consumers see the overall marketplace, the key attributes and benefits – giving us good insight on how to construct our brand positioning.
More Tools and Information
- What are Multi-Dimensional Scaled (MDS) Perceptual Maps?
- MDS Maps vs Correspondence Analysis Maps
- Premium MDS Mapping Template
- How to Make a MDS Map from Start to Finish (VIDEO)
- Overview of Multi-Dimensional Scaled (MDS) Perceptual Maps